When I was thinking this method I was thinking especially to the lack of discipline of the majority of traders I have been in contact for few years, they had various points of entry but only few and inconsistent exit points. This is a methodology taught and improved for several months, fourteen in number.
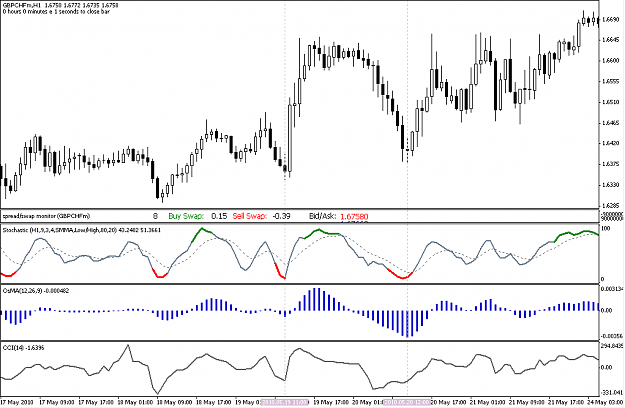
Firstly, I have to say the method implies the presence of the divergence on the one of the three indicators: Color stochastic, Moving average of the oscillator and the Commodity channel index. The reason I use three indicators is that, sometimes, on of the indicators doesn't show the divergence after loosing some momentum, after bouncing back from a support/resistance level and I don't need dead times in the market, in other words to waste time.
Secondly, we need a trend line to plot in on the chart and watch for the eventually change in momentum or a reversal in the trend.
The next tool will be a Fibonacci Expansion, a very useful tool for our method for assign the targets of profit. Later on, I will explain the use the use of this tool as I will explain the entries of each kind of situation, regarding the appearance of certain type of divergence, which will trigger a specified quantity of lots.
I will provide few elementary steps in order to enter in a trade, as following:
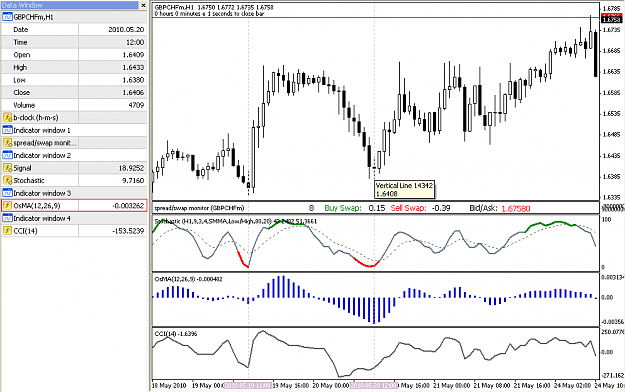
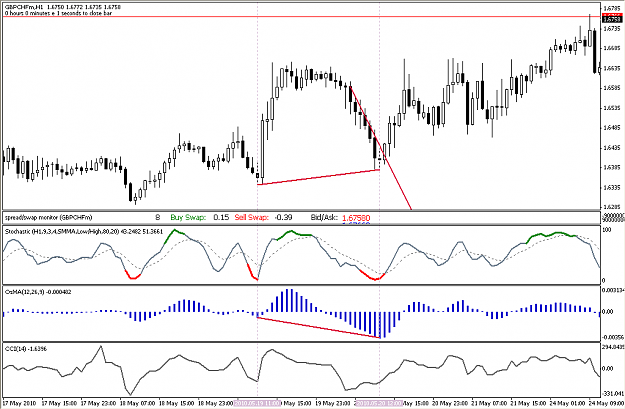
1.Establishing the highs/lows on which we measure the divergence
2. Measuring if there exist or not a valid divergence and establish the lot size you will trade
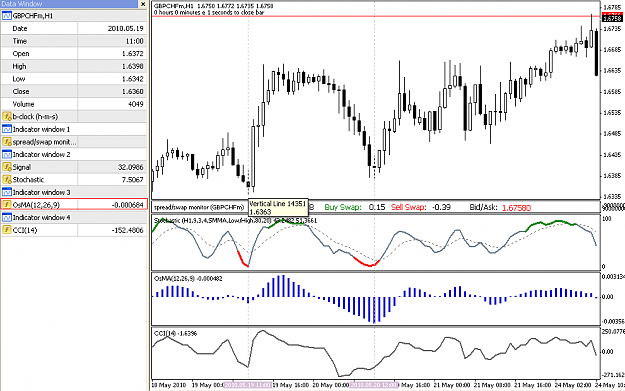
I have to mention that, in the case of hidden divergences, which could provide a greater move, the lot will be 10 times bigger than the classic types.
3. Plotting the divergences on highs/lows and the trend line if there exists the divergence
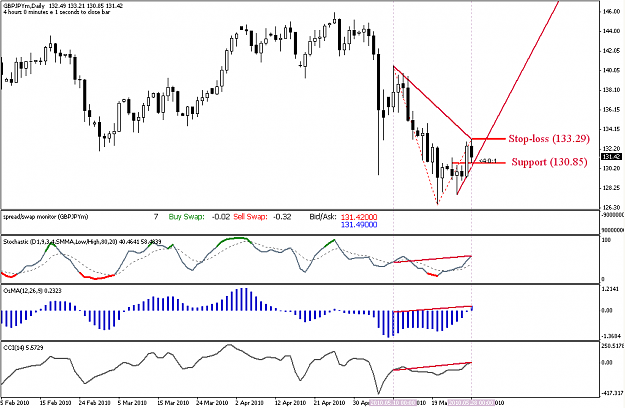
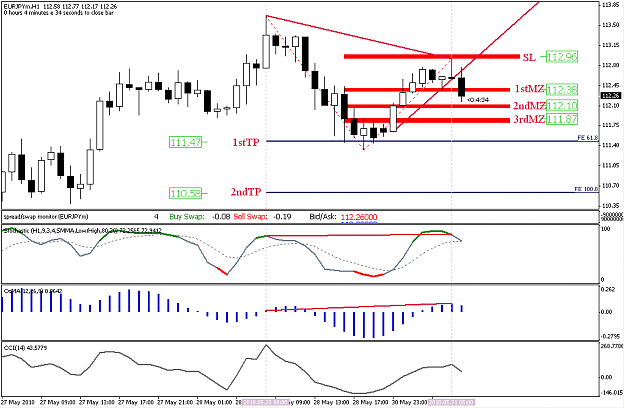
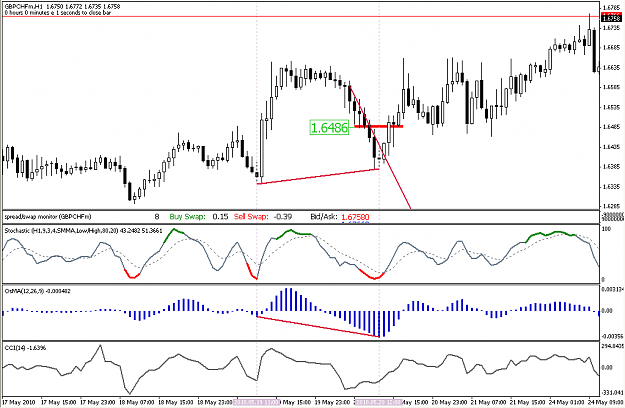
4. Drawing the future next support or resistance with the price level attached to it
5. Establishing the stop-loss which will be under the low or over the high (spread + 1 pip) and plotting the Fibonacci Expansion with the two of the value on the lows/high where we measured the divergence and the other value on the last important high/low
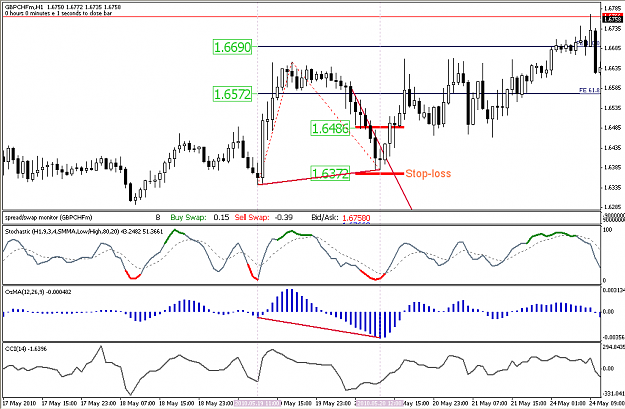
6. Waiting for trend line to be invalidated and entering in the transaction (image 6).
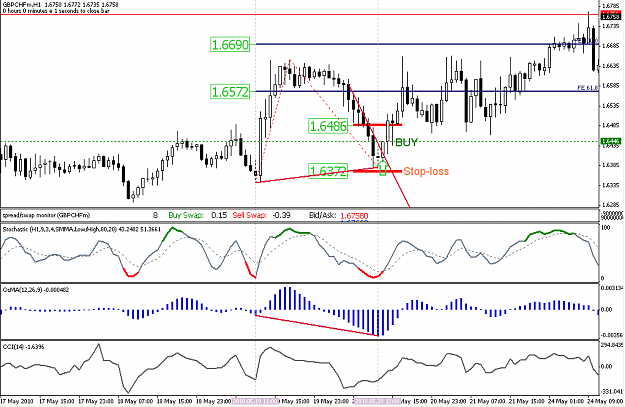
7. Management of the transaction.
When the price hits the first support/resistance on which particular case, the stop loss will be moved in positive area at 1 pip. If the price continues the movement and hits the targets, one by one, on each one of it we will be closing 1/3 of the remaining lot.
Presuming we have a 0.9 lot opened, at Fe 61.8 we'll close 0.3. At the next target price, Fe 100.0, we'll close 0.2 from the remaining lot and so on. If one of the targets is hit and the lot cannot be closed 1/3 (33,3% from it) we can close as much as we can, near 1/3 of it and we'll calculate the difference we couldn't closed it and move the stop loss from +1 pips to cover that difference.
Also, if the target three has been hit and we are still have a remaining lot, let's say 0.1 lot, we switch on a greater time frame, in our case on 4h, because we are on 1h time frame and wait for the same situation to appear, appearance of the divergence and other steps. If the divergence is already there, and the first target price is greater from the 3rd target price from 1h (our case) we'll take it in consideration and will put in on target price, if we cannot close another 1/3 of the transaction.
Also, we will cover the eventual negative swap by moving the stop loss and locking some more profit.
Firstly, I have to say the method implies the presence of the divergence on the one of the three indicators: Color stochastic, Moving average of the oscillator and the Commodity channel index. The reason I use three indicators is that, sometimes, on of the indicators doesn't show the divergence after loosing some momentum, after bouncing back from a support/resistance level and I don't need dead times in the market, in other words to waste time.
Secondly, we need a trend line to plot in on the chart and watch for the eventually change in momentum or a reversal in the trend.
The next tool will be a Fibonacci Expansion, a very useful tool for our method for assign the targets of profit. Later on, I will explain the use the use of this tool as I will explain the entries of each kind of situation, regarding the appearance of certain type of divergence, which will trigger a specified quantity of lots.
I will provide few elementary steps in order to enter in a trade, as following:
1.Establishing the highs/lows on which we measure the divergence
Attached Image (click to enlarge)
2. Measuring if there exist or not a valid divergence and establish the lot size you will trade
Attached Image (click to enlarge)
Attached Image (click to enlarge)
I have to mention that, in the case of hidden divergences, which could provide a greater move, the lot will be 10 times bigger than the classic types.
3. Plotting the divergences on highs/lows and the trend line if there exists the divergence
Attached Image (click to enlarge)
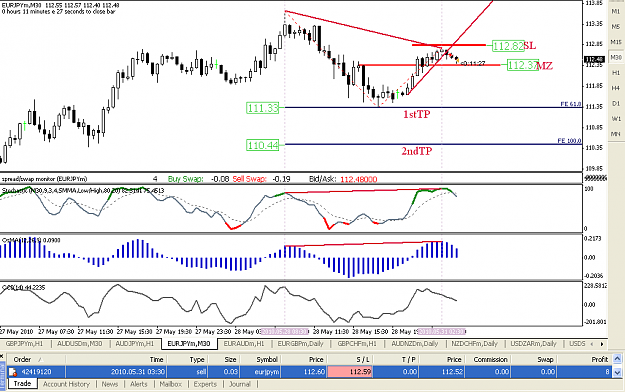
4. Drawing the future next support or resistance with the price level attached to it
Attached Image (click to enlarge)
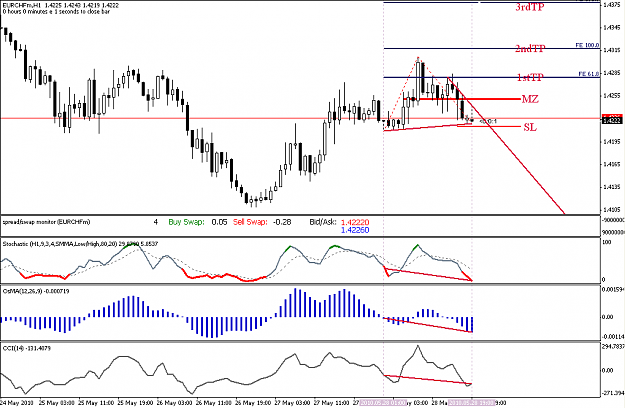
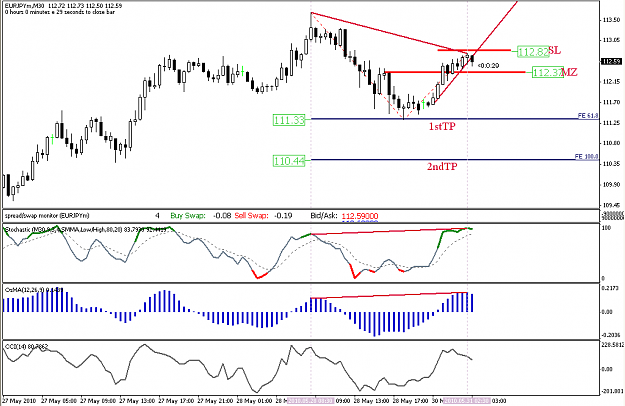
5. Establishing the stop-loss which will be under the low or over the high (spread + 1 pip) and plotting the Fibonacci Expansion with the two of the value on the lows/high where we measured the divergence and the other value on the last important high/low
Attached Image (click to enlarge)
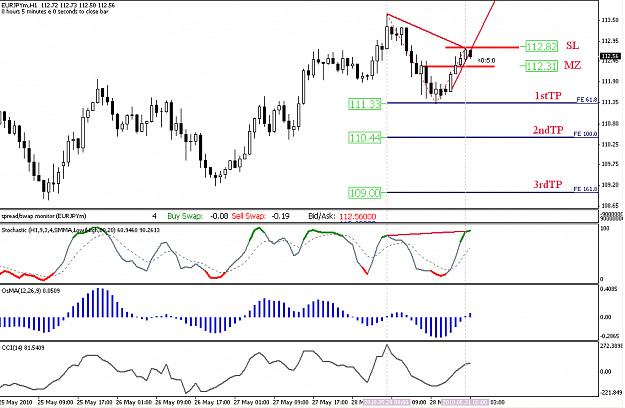
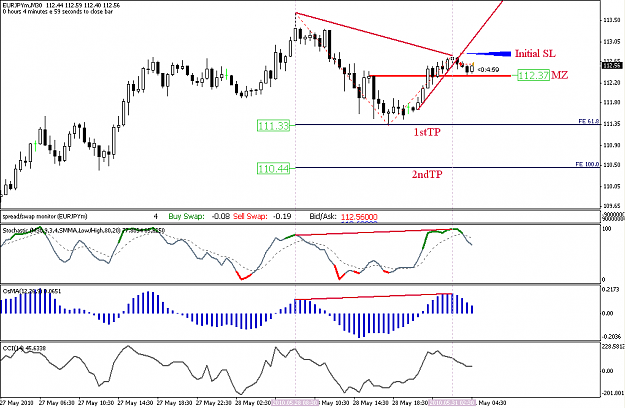
6. Waiting for trend line to be invalidated and entering in the transaction (image 6).
Attached Image (click to enlarge)
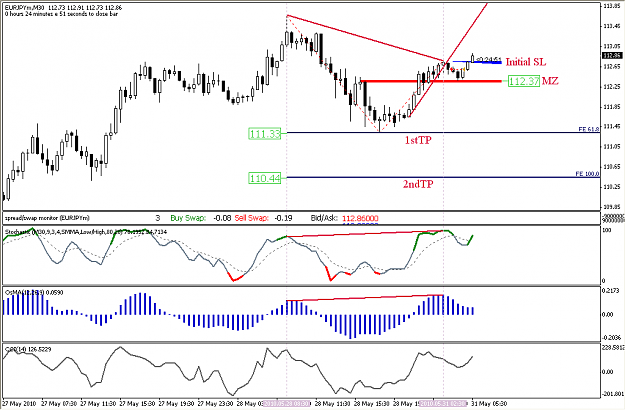
7. Management of the transaction.
When the price hits the first support/resistance on which particular case, the stop loss will be moved in positive area at 1 pip. If the price continues the movement and hits the targets, one by one, on each one of it we will be closing 1/3 of the remaining lot.
Presuming we have a 0.9 lot opened, at Fe 61.8 we'll close 0.3. At the next target price, Fe 100.0, we'll close 0.2 from the remaining lot and so on. If one of the targets is hit and the lot cannot be closed 1/3 (33,3% from it) we can close as much as we can, near 1/3 of it and we'll calculate the difference we couldn't closed it and move the stop loss from +1 pips to cover that difference.
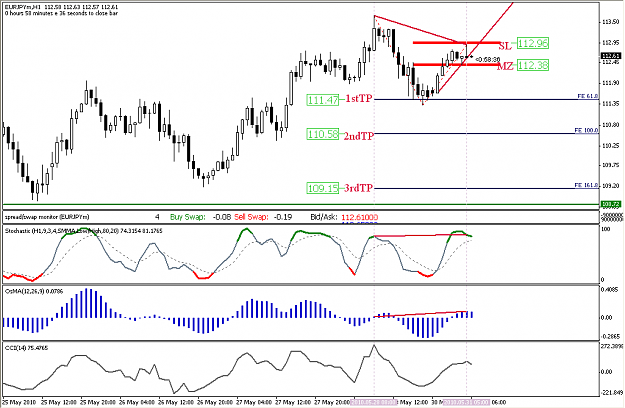
Also, if the target three has been hit and we are still have a remaining lot, let's say 0.1 lot, we switch on a greater time frame, in our case on 4h, because we are on 1h time frame and wait for the same situation to appear, appearance of the divergence and other steps. If the divergence is already there, and the first target price is greater from the 3rd target price from 1h (our case) we'll take it in consideration and will put in on target price, if we cannot close another 1/3 of the transaction.
Also, we will cover the eventual negative swap by moving the stop loss and locking some more profit.