Found this trading template at another forum (tsd) some weeks ago, and I add that "It is not mine".
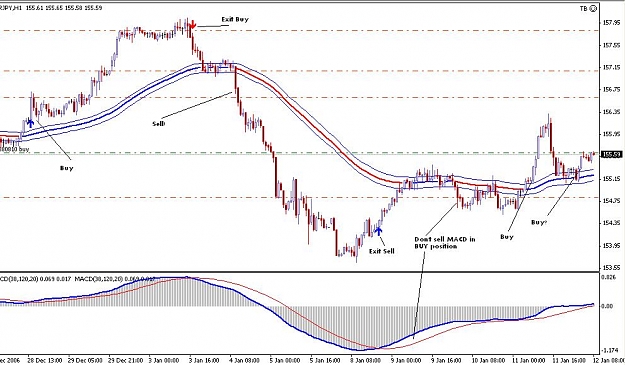
The rules are explained on the attached image
It is originally a 1H setup, but also looks good on 5min, 15min.
This is such a great forum and I thought to post this to see if it can be developed further and in the end could be of use to someone else.
edit: 2009-feb-07 06:35gmt - uploaded all indicators and template seperate.
the template has the following list of indicators:
Chart:
EMA - 80, high
EMA - 80, low
MA rsi - 80,1,0,40,50 ( of which the 40 is the period of the RSI and the 50 is the level)
macd cross - 38,120,20,false
Indicator window 1:
MACD - 38,120,20
MACD line - 38,120,20
EDIT: 2009-feb-9 04:50gmt as per post #58 on page 4
MA rsi - the indicator has been modified so that you can put different buy level and sell level. Default is 50, but you can set the buy level to 55 and the sell level to 45. The modified MA rsi indicator has now been added to the indicators below
EDIT: 2009-feb-10 05:30gmt
for the rules of this sytem (go to page 2 post #26 for the link in the TSD forum)
... and I quote "The rules are simple: Make a trade in a candle break, and use MACD and MA(80) as a filter. See the image for explanations...."
EDIT: 2009-Feb-17 13:40gmt (this is my prefered chart setup - no one needs to change their charts,this is just how I prefer it)
I have left the MACD cross indicator on the main chart set at 38,120,20 (the arrows)
I have changed my MACD to 12,26,6 and added a EMA21(close) to it
I have added a stoch 120,60,3 with level 50
I have tried to explain how I trade this sytem on page 6 posts #79 #80 #83 #90, page 7 #98
Siuol made a good suggestion of how to move your SL - page 7 #92
Attached Image (click to enlarge)
Attached File(s)