I found an interesting article at:
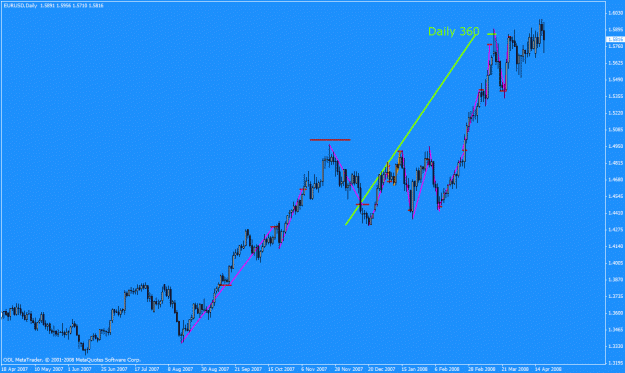
Square of Nine in Excel
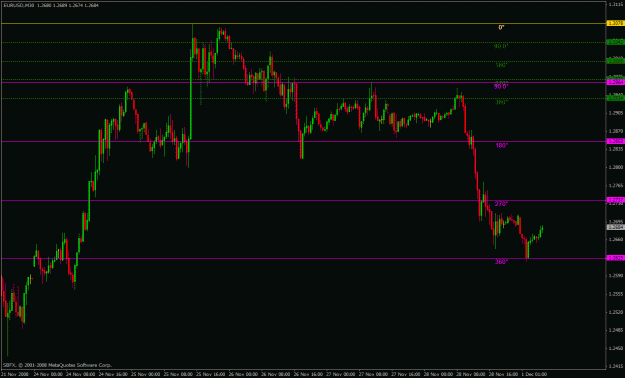
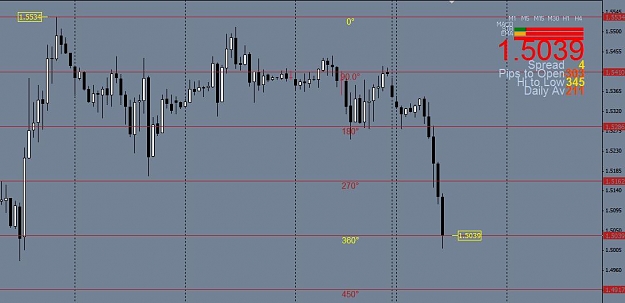
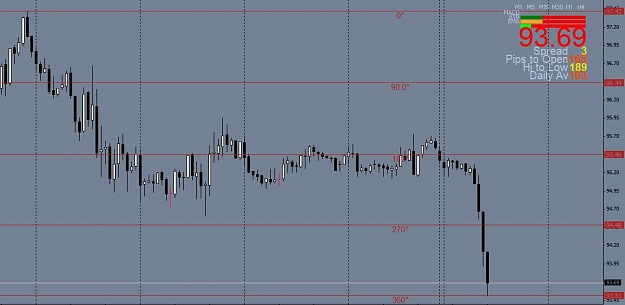
Then I came across an indicator by a guy with the nick name Coder, it seems to line up nicely at certain levels.
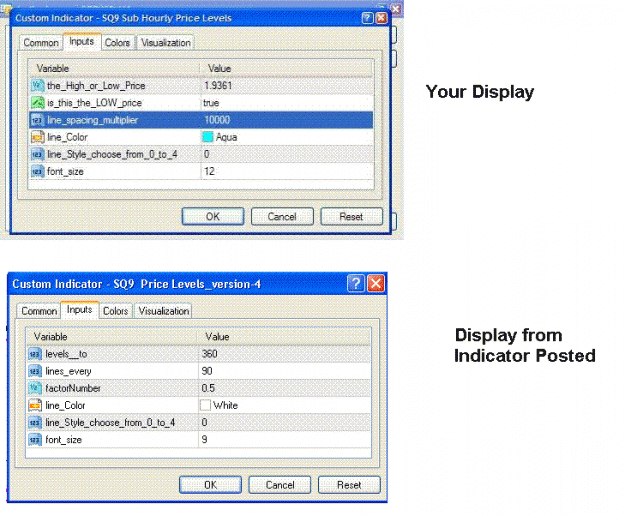
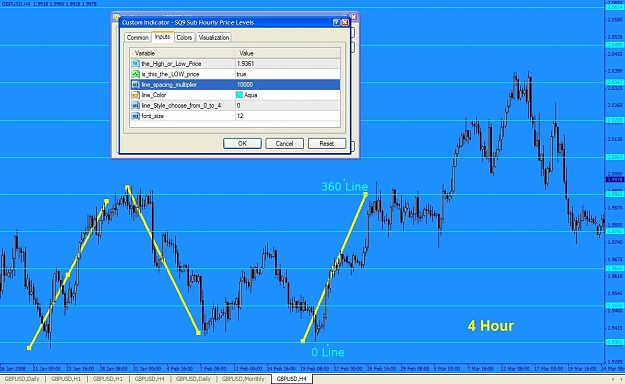
EDIT: Version 3, I have updated the indicator, just throw a Horizontal Line on a Price High and name the line -1 or -2 or -3 or -4 or -5 or -6, depending on how far apart you want the lines,
or
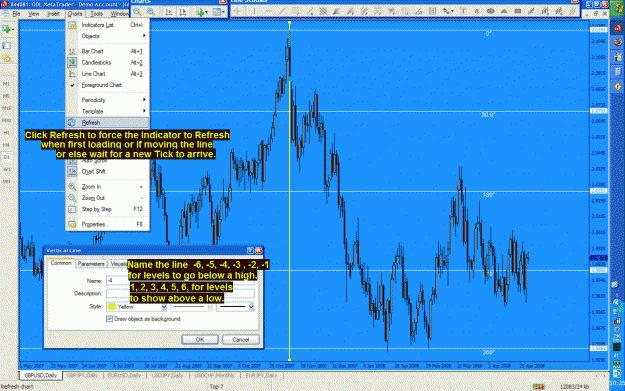
If it is a Price LOW then name the Line 1 or 2 or 3 or 4 or 5 or 6, depending on how far apart you want the lines.
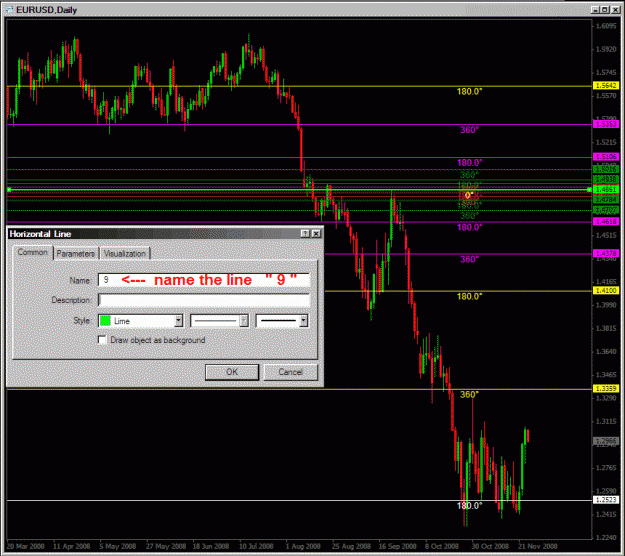
for Version 5 which are in the ZIP file SQ9_v5.x.zip you use a Horizontal Line and Name it 9 as described in this post
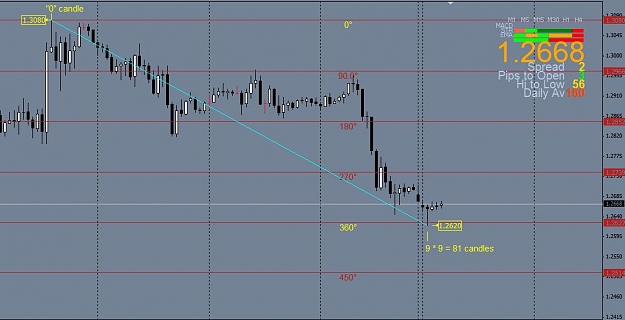
as shown in this picture here
Dean.
Square of Nine in Excel
Then I came across an indicator by a guy with the nick name Coder, it seems to line up nicely at certain levels.
EDIT: Version 3, I have updated the indicator, just throw a Horizontal Line on a Price High and name the line -1 or -2 or -3 or -4 or -5 or -6, depending on how far apart you want the lines,
or
If it is a Price LOW then name the Line 1 or 2 or 3 or 4 or 5 or 6, depending on how far apart you want the lines.
for Version 5 which are in the ZIP file SQ9_v5.x.zip you use a Horizontal Line and Name it 9 as described in this post
as shown in this picture here
Dean.
Attached Image(s) (click to enlarge)
Attached File(s)
perception is reality