I came up with idea about 10 minutes ago.... it makes too much sense....
Have you ever wondered what MA cross works best historically on a pair? NOW YOU CAN FIND OUT!
The EA attached incorporates the MT4 optimizer, and cycles through all permutations of MA crosses, and gives you a list of all profitable crosses in a range over a given period of time.
YOU decide the timeframe and pair, and the max and min ranges to test.
I must pat myself on the back for this one.
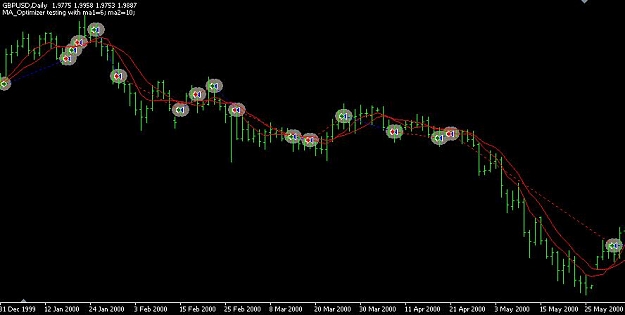
Instructions: Run w/ strategy tester.... select timeframe and pair.... In Expert Properties set ma1 to 1, and ma2 to 2 .... set "Step" to 1 for both... set "Stop" to a high number for ma2 (say 10,) and ma1 to ma2 - 1 (9 in this example)
Check Optimization, and click Start. Click the Optimization Results tab and wait for it to cycle through all permutations.... if the cross was profitable, it will appear on the chart...... when it finishes cycling through all permutations (this could take awhile,) click the "Profit" heading repeatedly until the profit is sorted in ascending order.... then look at the values for ma1 and ma2 for the first item in the list...
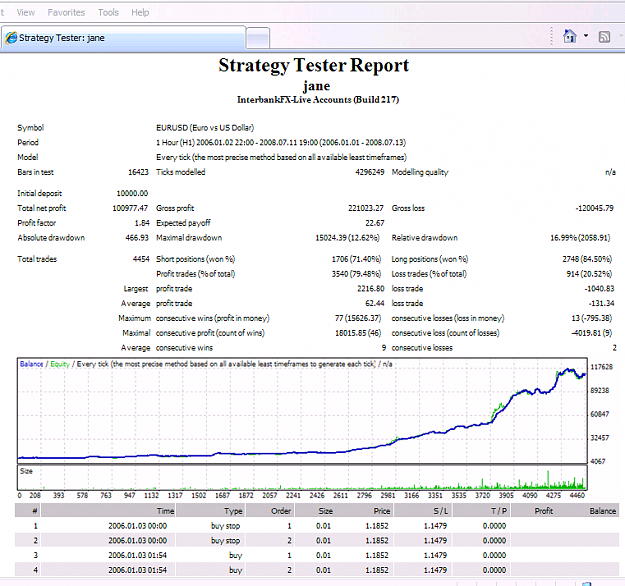
Now uncheck Optimization, and replace ma1 and ma2 with the numbers you just retrieved.... run the backtest, and then look at the Graph and Report.
This EA works on the closed bar of the timeframe you select.
EDIT) If your chart system truly has a quantifiable edge, there should be no reason why optimal historical parameters can't be found with this type of EA.
Have you ever wondered what MA cross works best historically on a pair? NOW YOU CAN FIND OUT!
The EA attached incorporates the MT4 optimizer, and cycles through all permutations of MA crosses, and gives you a list of all profitable crosses in a range over a given period of time.
YOU decide the timeframe and pair, and the max and min ranges to test.
I must pat myself on the back for this one.
Instructions: Run w/ strategy tester.... select timeframe and pair.... In Expert Properties set ma1 to 1, and ma2 to 2 .... set "Step" to 1 for both... set "Stop" to a high number for ma2 (say 10,) and ma1 to ma2 - 1 (9 in this example)
Check Optimization, and click Start. Click the Optimization Results tab and wait for it to cycle through all permutations.... if the cross was profitable, it will appear on the chart...... when it finishes cycling through all permutations (this could take awhile,) click the "Profit" heading repeatedly until the profit is sorted in ascending order.... then look at the values for ma1 and ma2 for the first item in the list...
Now uncheck Optimization, and replace ma1 and ma2 with the numbers you just retrieved.... run the backtest, and then look at the Graph and Report.
This EA works on the closed bar of the timeframe you select.
EDIT) If your chart system truly has a quantifiable edge, there should be no reason why optimal historical parameters can't be found with this type of EA.
Attached File(s)