Today I came to my eureka moment and I hope this can in some way help someone else. My biggest problem with fibonacci has always been, which one is more important and on what time frame. After endless amounts of time searching for the optimal scenario, I came to the conclusion that fibos are just an attempt to complicate a relatively simple idea. In fact, I think fibos only work because of their similarity with this Idea.
I have always liked the idea of Volume Weighted Average Price because it gave me some sense of equilibrium or inflection point within the bar that I am trading. In forex though, we miss the volume component so we must look elswhere for something that will let us know where this equilibrium may occur. For me that is the pivot point. It is how price closes in relation to this point that will let me determine who is winning the battle, buyer or seller. Most of us use daily pivot points and then drop down in time frame to see how price reacts to this point. I feel that here is where my first problem was coming from. If I am using a daily pivot to trade intraday, I am accepting risk on basis of daily timeframe for a reward that is usually less. I feel pivot points should only be considered on close for that period. If price closes above daily PP on daily chart, then buyers won for the day in comparison with yesterdays information.
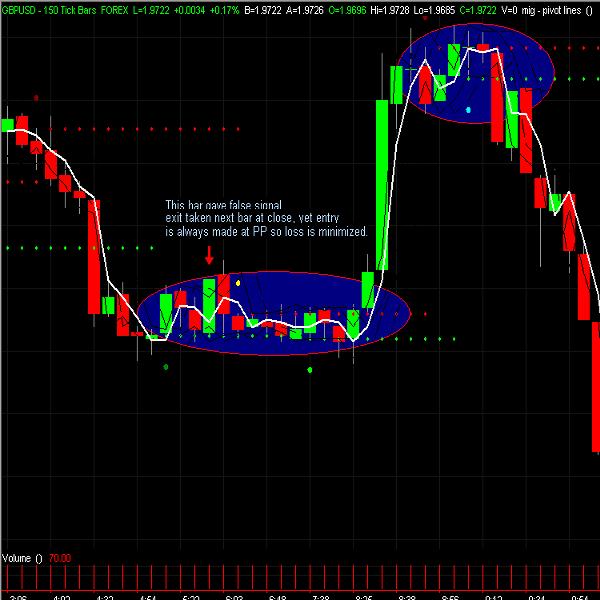
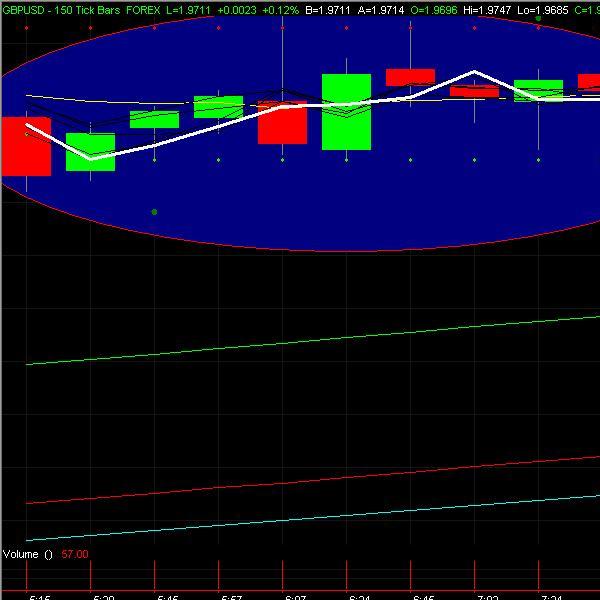
Since my account is not funded for those types of swings, I created my pivot point indicator that basically just plots the PP as a line on any timeframe. I like this because I can litteraly see on the close of each bar who is winning the battle on that timeframe. I like to see alternating closes above and below the PP because this shows me the battle is on. It builds a small range of sorts. finally, when there is a close above or below this range, you usually see a move. Granted, you may only pick up 5 or ten pips once it comes below the PP again but it seems to be pretty accurate, and on days like today, you would have gone from 1.9500 to 1.9633 before your first potential exit signal(I know, many systems worked today but thats not the point). More importantly, it seems consistent with small drawdown, decent reward and always a potential for a very high reward. Used with a good MM system, you will book many profits and maybee even let a couple of freeones ride.The key here is that I dont use it on time charts, rather on tick charts so that it may be traded at anytime during the day, without the effect of time skewing the PP.
Lastly, I started to think about it and I have decided that fibonacci works because of this PP and what it represents. It is an average price of sorts for the preceding timeframe. If you use h+l+c/3 - you will realize that any retracement to the PP will be very close to fibonacci, close enough to consider the difference negligible. WHich fibo of course totally depends on where the previous close was. The beauty of this is also that you don't need to search a thousand timeframes where to enter, but a careful examination of PP over many different level tick charts can sometimes show you some very big open spaces where price may run to.
I may be totally full of shit, but it works for me, hope it may help you too.
I have always liked the idea of Volume Weighted Average Price because it gave me some sense of equilibrium or inflection point within the bar that I am trading. In forex though, we miss the volume component so we must look elswhere for something that will let us know where this equilibrium may occur. For me that is the pivot point. It is how price closes in relation to this point that will let me determine who is winning the battle, buyer or seller. Most of us use daily pivot points and then drop down in time frame to see how price reacts to this point. I feel that here is where my first problem was coming from. If I am using a daily pivot to trade intraday, I am accepting risk on basis of daily timeframe for a reward that is usually less. I feel pivot points should only be considered on close for that period. If price closes above daily PP on daily chart, then buyers won for the day in comparison with yesterdays information.
Since my account is not funded for those types of swings, I created my pivot point indicator that basically just plots the PP as a line on any timeframe. I like this because I can litteraly see on the close of each bar who is winning the battle on that timeframe. I like to see alternating closes above and below the PP because this shows me the battle is on. It builds a small range of sorts. finally, when there is a close above or below this range, you usually see a move. Granted, you may only pick up 5 or ten pips once it comes below the PP again but it seems to be pretty accurate, and on days like today, you would have gone from 1.9500 to 1.9633 before your first potential exit signal(I know, many systems worked today but thats not the point). More importantly, it seems consistent with small drawdown, decent reward and always a potential for a very high reward. Used with a good MM system, you will book many profits and maybee even let a couple of freeones ride.The key here is that I dont use it on time charts, rather on tick charts so that it may be traded at anytime during the day, without the effect of time skewing the PP.
Lastly, I started to think about it and I have decided that fibonacci works because of this PP and what it represents. It is an average price of sorts for the preceding timeframe. If you use h+l+c/3 - you will realize that any retracement to the PP will be very close to fibonacci, close enough to consider the difference negligible. WHich fibo of course totally depends on where the previous close was. The beauty of this is also that you don't need to search a thousand timeframes where to enter, but a careful examination of PP over many different level tick charts can sometimes show you some very big open spaces where price may run to.
I may be totally full of shit, but it works for me, hope it may help you too.
Man who scratches ass should not bite fingernails