Hi everyone!
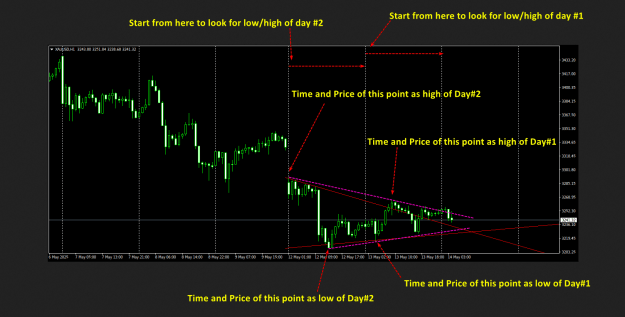
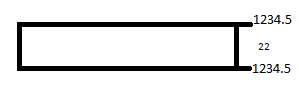
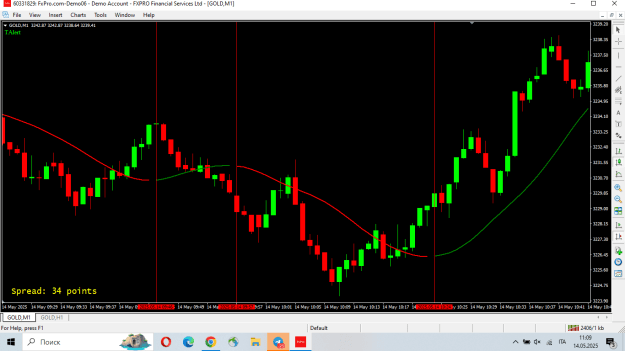
Can you check this indicator? There is a problem when the line inverts: the line for 1 bar is not drawn.
Can you check this indicator? There is a problem when the line inverts: the line for 1 bar is not drawn.
Attached Image (click to enlarge)
Attached File(s)