This first post will try and explain how to trade the news in the system's most basic terms but as the thread goes on we will be deep diving into a decent amount of technical concepts that will hopefully teach you something you don’t already know.
Please makes sure to read everything below before asking questions, but if anything is unclear or needs additional explanation let me know and I'll post a follow-up.
To keep things simple let’s set up some basic rules to keep the thread and discussion on track.
The system is based on 3 “indicators” and they are:
- Price (OHLC Data)
- 200 MA
- News Volatility/Volatility in general.
The most important of the three is #3 since our opportunity to make money is directly related to the amount of volatility we are able to trade.
Starting off we will only be looking at the following USD pairs:
- EUR/USD
- GBP/USD
- AUD/USD
- NZD/USD
- USD/CAD
- USD/CHF
- USD/JPY
These are typically the most liquid currency pairs. They will allow us to trade all of the major currencies' high-impact news events, giving us ample opportunities to make profits.
Now that the general rules are covered, I want to touch briefly on the core idea behind this strategy. It can be summed up in the paragraph below:
It’s better to focus on managing exposure than it is to focus on forecasting. By focusing on your f(x), you can know little to nothing about x and still be successful.
I touched on this in a bit more detail in the thread below so I highly recommend reading it if you haven’t already: https://www.forexfactory.com/thread/...9#post14314499
This system puts a good amount of focus on x, but the engine is our f(x).
The f(x) of this system is based on something called “dynamic replication”, a concept used by market makers to hedge non-linear payoffs using linear products.
We will do a deep dive into this concept and why it matters later but all you need to understand about it is this.
Your current position size in a trade is equal to your max position size, multiplied by the current probability of your trade being a winner. I'll detail in a follow-up post a few different ways you can estimate this probability but for some quick back-of-the-napkin math, when you enter, you are at 50%, and every couple of pips in either direction increases or decreases it by a few points. You can't constantly adjust the position so I usually do it in increments of 5-10% changes in the probability of the trade being a winner.
As long as you maintain this position sizing, you will be structuring your f(x) so that it changes from a linear to a non-linear payoff. If you can maintain a non-linear payoff, you don’t need to worry about forecast x in a directional sense. You only need to make sure you trade x when it is volatile.
Let’s wrap this first post up with somewhat of an “example” setup looking at the next high-impact news event.
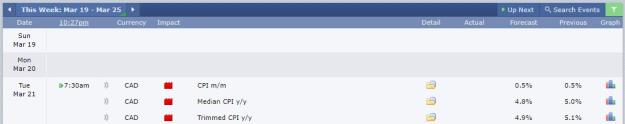
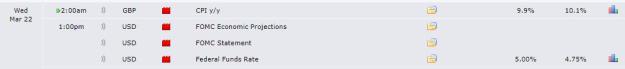
Next on the docket is Canada’s CPI numbers. Will they be better or worse than expected? Who knows, and who really cares? All I care about is the volatility the event will bring.
Since this is a CAD event, we will be looking to trade USD/CAD.
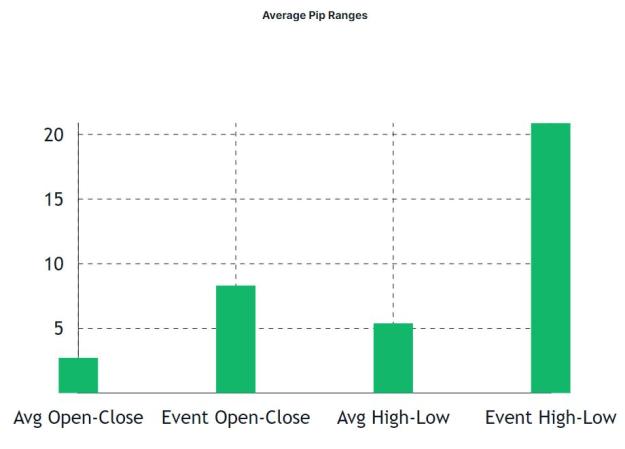
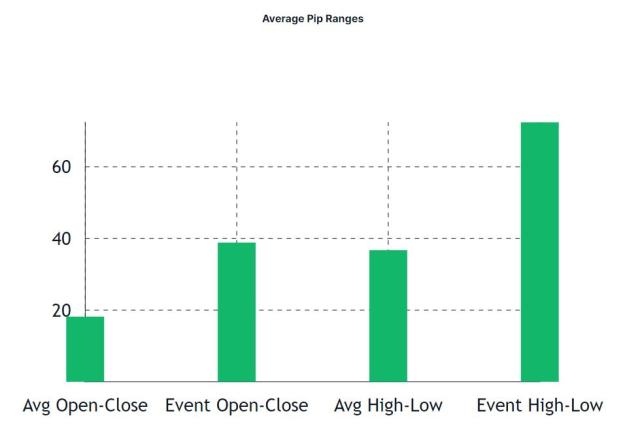
Let’s look at how the price's typical volatility stacks up to this event's historical volatility.
Below shows the average open-close and high-low range for any 4-hour period of USD/CAD in addition to the average ranges for 4-hour periods that contain this event 5 minutes after the period begins.
We can see that this event does bring above-average volatility and we can expect that the range we will see on Tuesday from 7:25 am to 11:25 am is likely to have 2x or more volatility that the average 4-hour period.
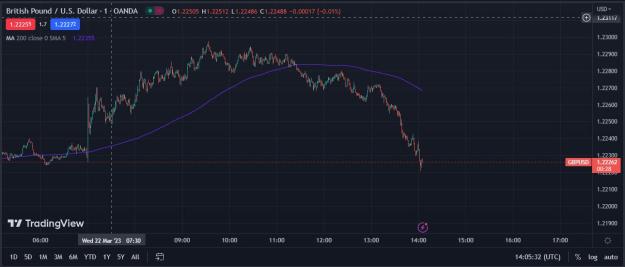
Since we need volatility to take advantage of our f(x), this will be the perfect time to trade. I'll likely be looking to trade in the direction of the 200MA. I won't be entering until about 5 minutes before the event though.
Overall the long haul, your forecasting of direction will converge towards 50%. We are not too worried about x though as f(x) is our engine. All we care about x is that it's volatile as we are trying to take advantage of excess kurtosis.
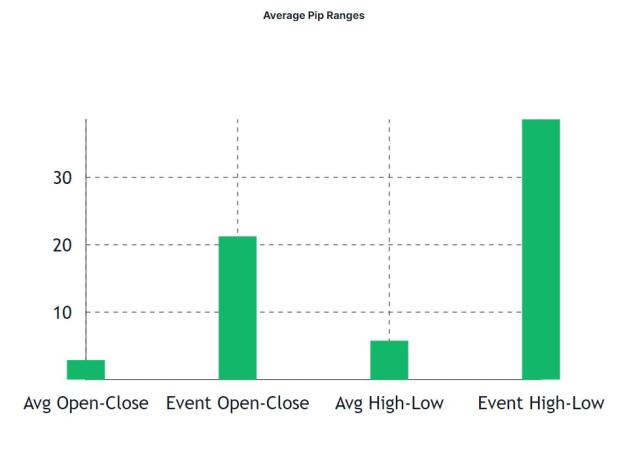
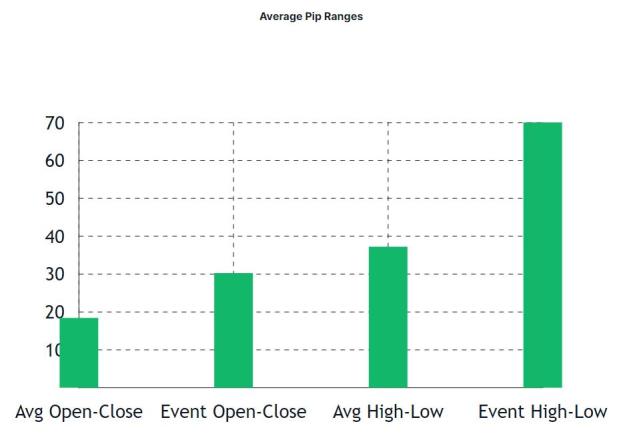
Something to note about this event, most of the whipsaw (high-low range) occurs in the first 5 minutes (the chart below is for the first 5 minutes after the event). After that, the direction should be clear and the price will likely continue on the path it's currently on.