Trendline Testing
Vic has already told us that patterns are more reliable on longer term trends so I’m going to use the D1 timeframe, using DIS and start at the beginning of the year, but in 2019 to give us some chances to catch long-term trend changes.
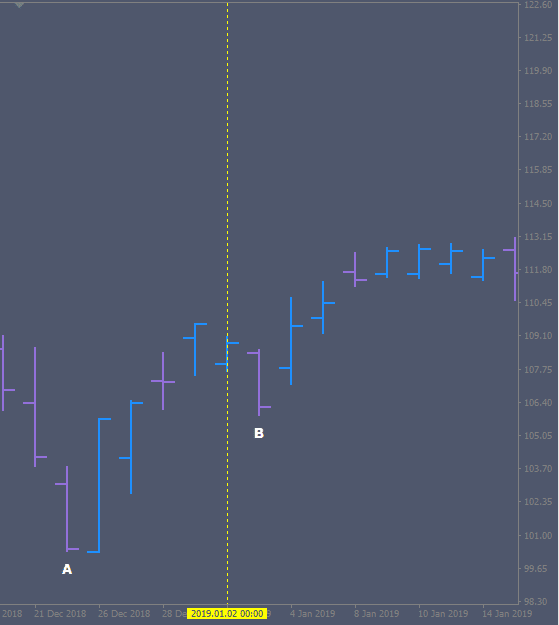
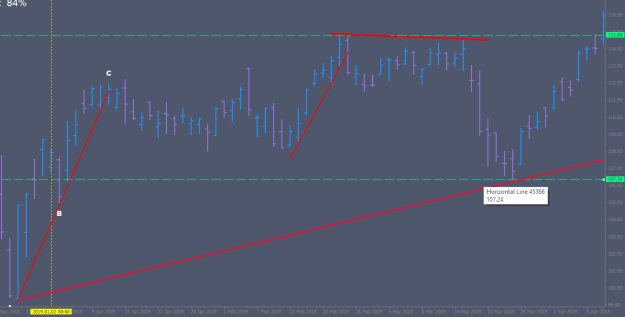
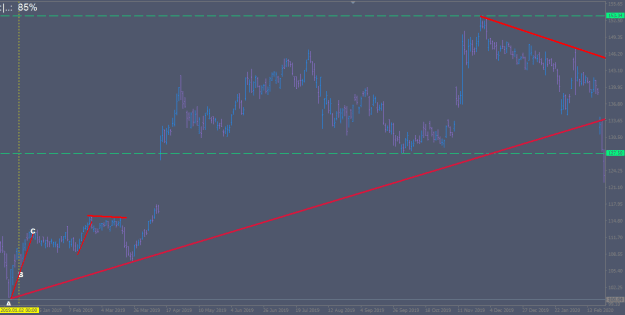
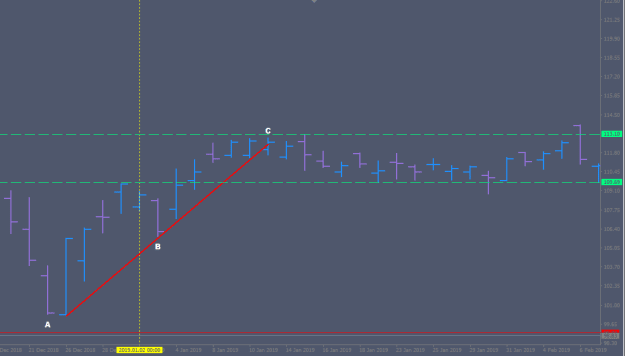
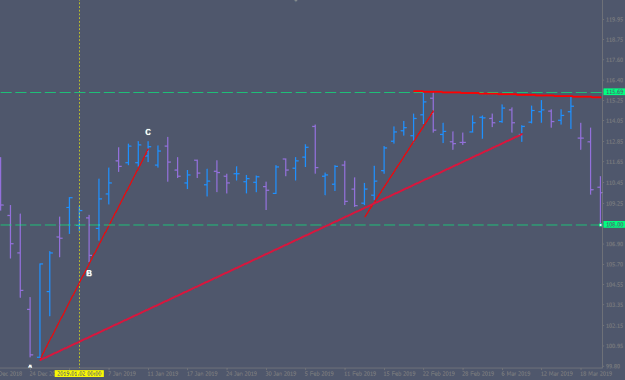
This is the starting condition. We see the previous low at (A) and a minor low point to hang the trendline at (B).
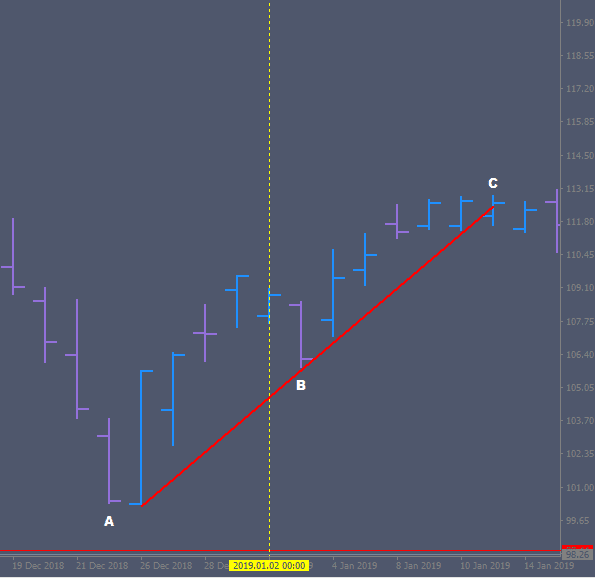
But after drawing the trendline and seeing it broken at (C) there doesn’t seem to be enough variation in the ‘line’ (range) to draw a box around it and define the ‘bear’ turning point? So we wait for the range to define itself. It seems like this was the approach taken in the example we were given.
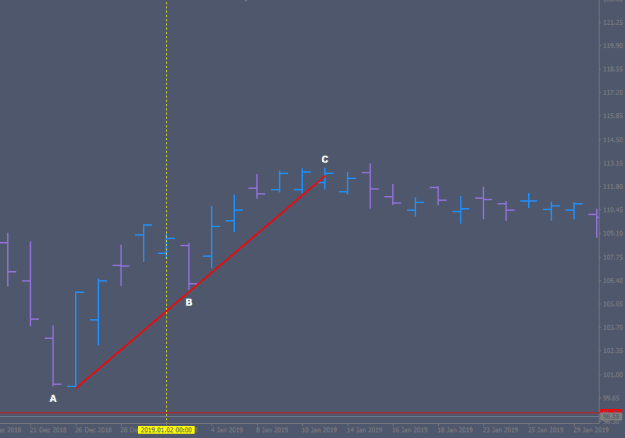
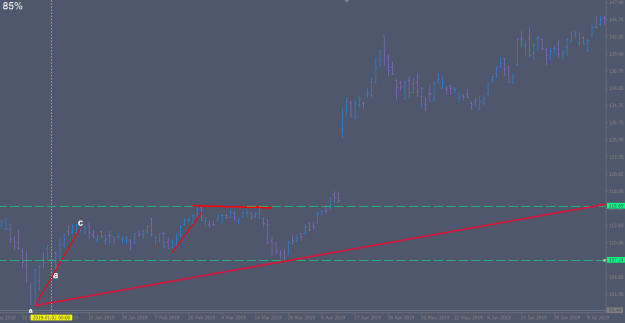
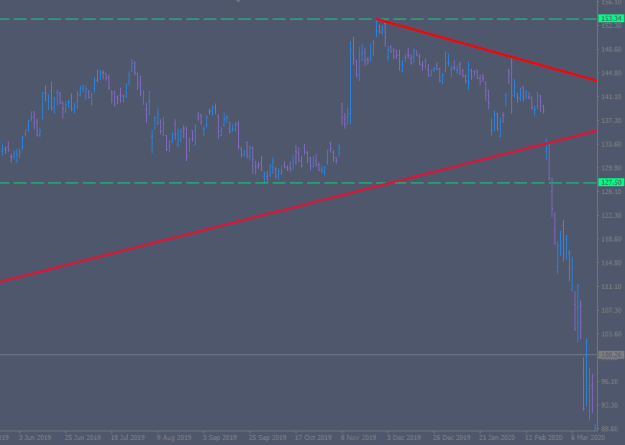
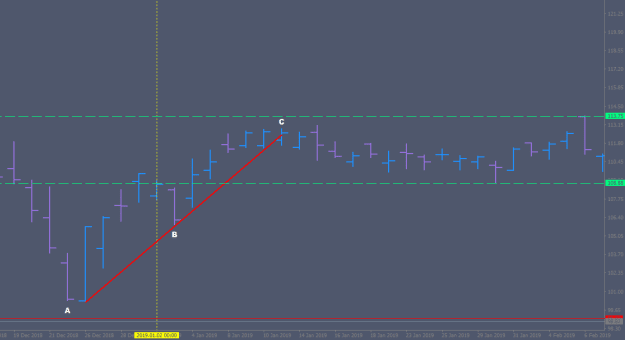
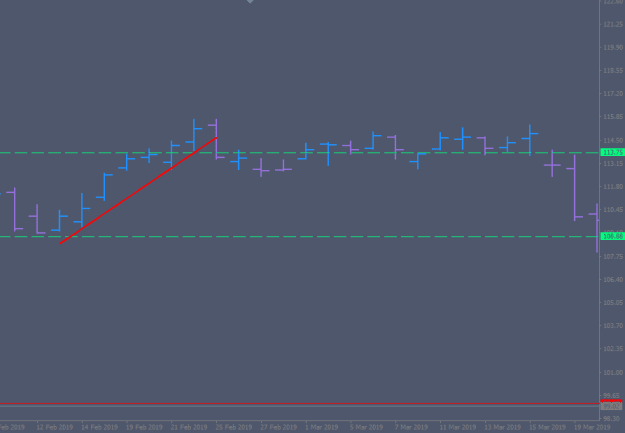
Do we have it yet? I recall that at least one other author says we need to see something touch at two points. This is just a steady leak down. But if I wait much longer I could lose all advantage from not entering early. Vic has told us the key is to get in early.
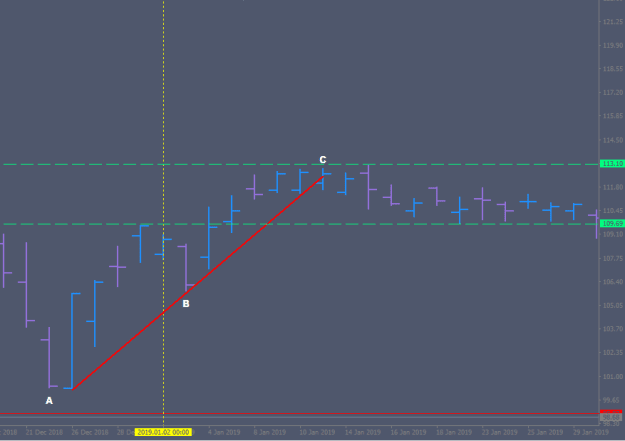
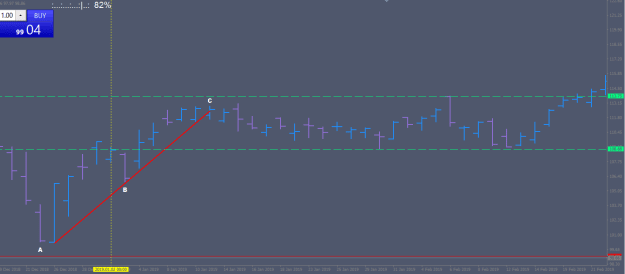
So I come up with this and it appears the uptrend has been broken. The trend is down?
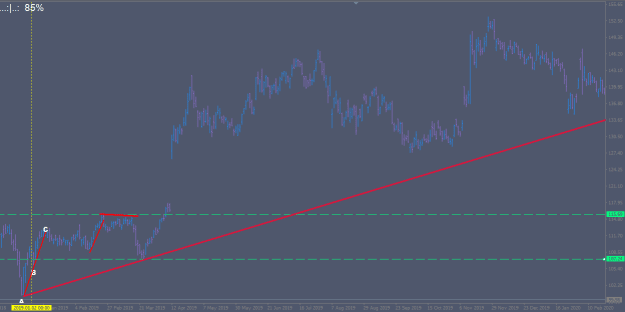
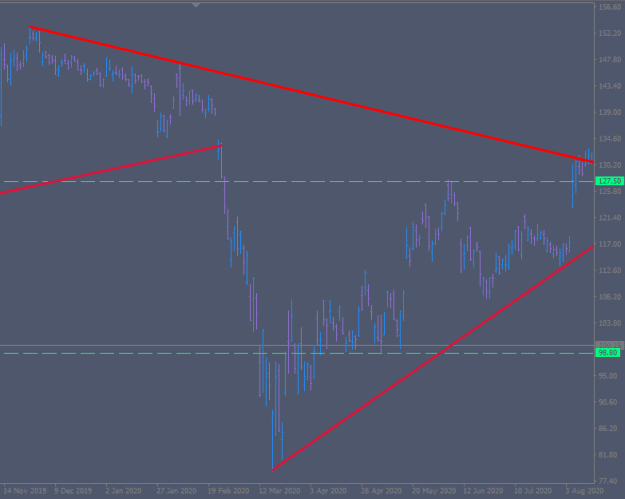
What do I do now? Redraw the box I suppose?
This time we’ll get it.
I guess the trend is still up. Let’s draw a new trendline then?
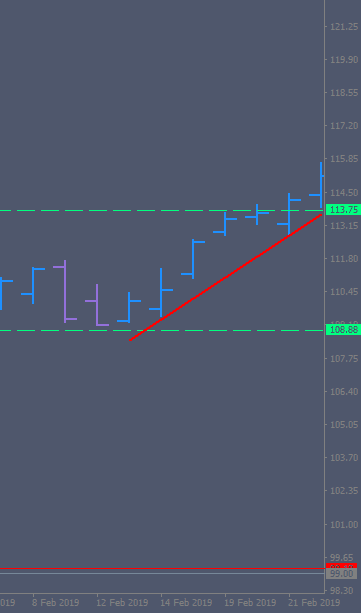
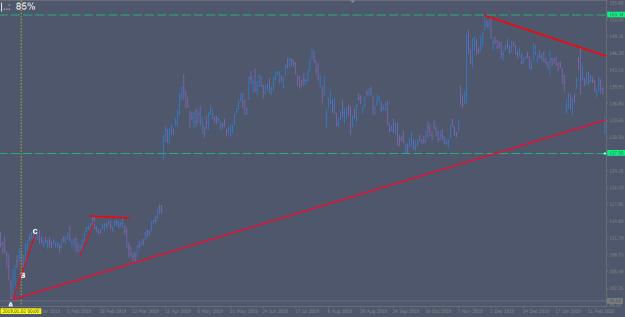
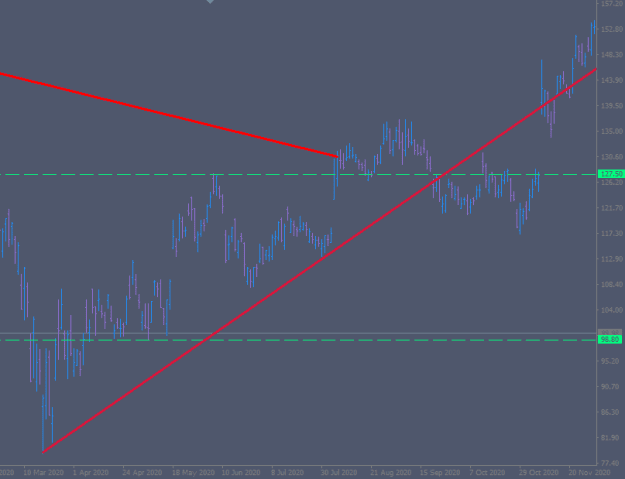
I’ll move the ‘box’ lines once I know where to put them. Let’s assume I went long at the break of the upper line. So if we started mid-January we are entering the first trade say 2019.02.20?
Bloody hell. Well, Vic doesn’t use this for entries, remember. This is all about ‘confirmation’. So if this were a system you’d have to decide whether to exit immediately upon trendline break or upon the second line break. Clearly you’re better off getting out immediately in this case. But now what? Redraw the box again? Or is this a downtrend now? I don’t have enough data to draw a down trendline.
If I redraw the box, and redraw the bullish trendline according to regulations I see that it’s already broken. If I attempt to draw a bearish trendline it is at a comically shallow angle. I guess this whole exercise is at least telling me I shouldn’t see any evident trend.
Vic has already told us that patterns are more reliable on longer term trends so I’m going to use the D1 timeframe, using DIS and start at the beginning of the year, but in 2019 to give us some chances to catch long-term trend changes.
Attached Image (click to enlarge)
This is the starting condition. We see the previous low at (A) and a minor low point to hang the trendline at (B).
Attached Image (click to enlarge)
But after drawing the trendline and seeing it broken at (C) there doesn’t seem to be enough variation in the ‘line’ (range) to draw a box around it and define the ‘bear’ turning point? So we wait for the range to define itself. It seems like this was the approach taken in the example we were given.
Attached Image (click to enlarge)
Do we have it yet? I recall that at least one other author says we need to see something touch at two points. This is just a steady leak down. But if I wait much longer I could lose all advantage from not entering early. Vic has told us the key is to get in early.
Attached Image (click to enlarge)
So I come up with this and it appears the uptrend has been broken. The trend is down?
Attached Image (click to enlarge)
What do I do now? Redraw the box I suppose?
Attached Image (click to enlarge)
This time we’ll get it.
Attached Image (click to enlarge)
I guess the trend is still up. Let’s draw a new trendline then?
Attached Image (click to enlarge)
I’ll move the ‘box’ lines once I know where to put them. Let’s assume I went long at the break of the upper line. So if we started mid-January we are entering the first trade say 2019.02.20?
Attached Image (click to enlarge)
Bloody hell. Well, Vic doesn’t use this for entries, remember. This is all about ‘confirmation’. So if this were a system you’d have to decide whether to exit immediately upon trendline break or upon the second line break. Clearly you’re better off getting out immediately in this case. But now what? Redraw the box again? Or is this a downtrend now? I don’t have enough data to draw a down trendline.
Attached Image (click to enlarge)
If I redraw the box, and redraw the bullish trendline according to regulations I see that it’s already broken. If I attempt to draw a bearish trendline it is at a comically shallow angle. I guess this whole exercise is at least telling me I shouldn’t see any evident trend.