The indicator is very effective in catching accurate trend lines, plus it also doesn’t make your trading dashboard messy. It removes a trend line from the chart once it becomes invalid.
The Auto TrendLine indicator is a vital forex trading tool especially for traders that use trend lines for trade entries and exits. To such traders, this MT4 indicator would come in handy as it takes away the pain of manually drawing trend lines daily.
Furthermore, the indicator is suitable for both intraday and mid-term trading styles. It performs best when used on the M15-H1 timeframes.
For whom is The Indicator Suitable?
The Auto TrendLine indicator would be a valuable asset for novice and experienced traders. The indicator can help a novice trader to quickly grasp how to identify and plot trend lines correctly. This can be achieved by observing how the indicator connects different swings to plot a trend line.
Conversely, the indicator makes trading less stressful for experienced traders, thereby saving them more time. They can easily anticipate market moves by merely looking at what the Auto TrendLine indicator is doing on their chart.
Drawing Trend Lines Techniques
The Auto Trend Line indicator automatically scans through the data of a chart to identify all the available trend lines. It then uses an advanced filter feature to further streamline the trend lines into just two. These include the uptrend line and the downtrend line which are depicted in blue and orange colors respectively.
Trend Projection
The Auto TrendLine indicator has two signal lines: the solid and dotted lines. Both lines convey different information.
The solid line represents the indicator’s trendline. In other words, it shows that the indicator has established a trend line.
The dotted lines on the other hand are projections that suggest that the price would continue in that direction. The lines are also used to anticipate where the price and trend line would most likely interact. Simply put, the dotted lines are a potential continuation of the trend line.
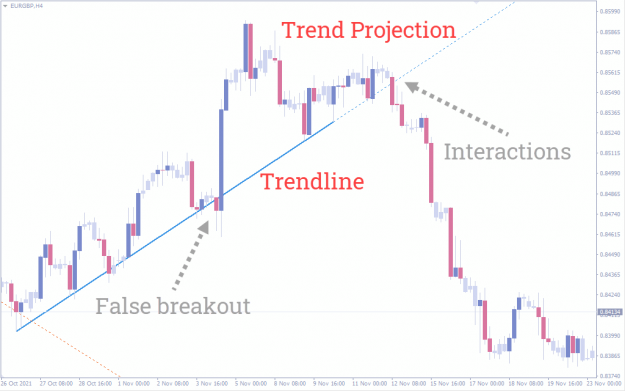
The above picture typifies how the Auto TrendLine indicator works on a chart.
How To Trade Using The Auto TrendLine Indicator
Trend line trading strategy is commonly built around two phenomena: trend line breakouts and price bounce. The indicator can be used alone to trade successfully.
- Price Bounce From Trend line
When the price gets to an established trend line, two outcomes are anticipated – price may bounce on the trend line and reverse or break through it. Price bounce/rejection off the trend line is one of the most traded trends continuation strategies.
This is because price tends to respect trend lines. After all, they are strong support/ resistance levels, especially on the higher time frames. Thus, BUY/SELL orders can be placed once the price bounces on the uptrend line or downtrend line as the case may be.
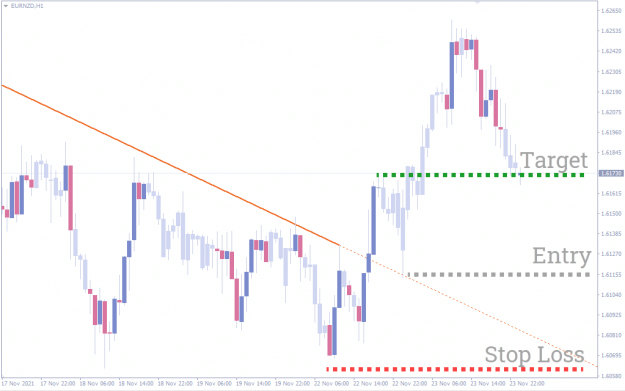
The above picture is an example of how to generate a BUY signal with the Auto TrendLine indicator. The entry candlestick bounced off the trend line which signifies a possible uptrend continuation.
The ideal zone to Take Profit should be around the corresponding trend line (in red), marked as TP1. You can also take profit at the previous high (TP2) as seen on the chart above.
In trading, Stop Loss is discretionary to every trader. Regardless, it is a safe practice to set Stop Loss below or above the previous highs/lows. But in all, your risk to reward determines how big your Stop Loss would be.
- Trend Line Breakout
Over time, established trend lines will be violated (broken) by price as the market trend changes. Thus, trend line breakouts are also good trading opportunities just like when the price bounces off the trend line.
Trend line breakout BUY entry: Wait for the price to clearly break out of the trend line and retest the line again before placing a BUY/LONG entry.
Trend line breakout SELL entry: Wait for the price to first break out of the trend line and retest the line again before placing a SELL/Short order.
Waiting for price to first retest a trend line after it broke it before placing a BUY/SELL position helps to filter fake breakouts. In essence, price retest helps to confirm/validate the breakout.
The above chart is used to illustrate how to generate a BUY signal and entry. A BUY trade would have been placed after price retested the trend line as seen in the picture above.
Take Profit should ideally be set at the recent high of price from the breakout. Again, Stop Loss order varies based on a trader’s risk to reward ratio.
The Auto TrendLine Indicator Settings
The indicator is built with a highly optimized algorithm responsible for identifying and plotting accurate trend lines. Let’s take a look at the indicator’s settings.
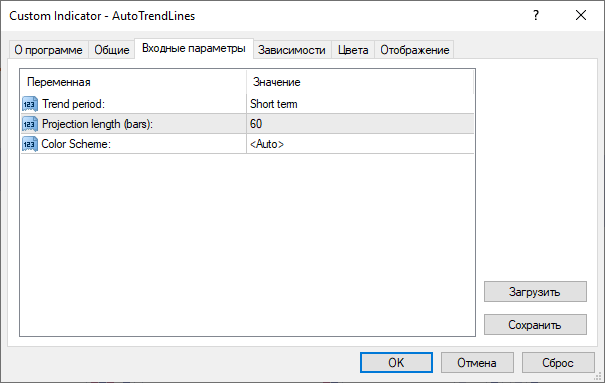
Trend Period:
Short – 300 candles.
Mid – 600 candles.
Long – 1200 candles.
Projection length – this shows the bars of the anticipated trend line.
Color Scheme – this shows the color of the trend lines. The color is automated to suit the background color of your dashboard.
Conclusion
The Auto Trend Line indicator automatically identifies and draws an accurate trend line on the chart. The data is precise and reliable. This implies that you can comfortably use this indicator to trade your favorite tend breakout strategy without much hassle.
Indicator installation
Download Link
1. Download and unzip the archive to the MQL4 folder of the terminal;
2. Restart the terminal and run the indicator;
3. Allow import of DLLs.