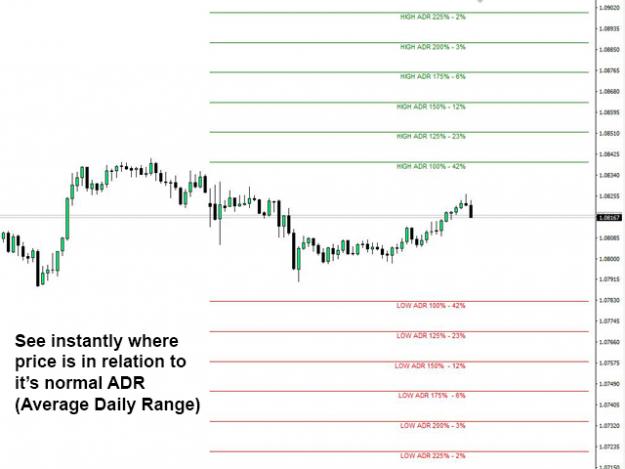
Salva aprendo una nuova discussione, qualcuno ha visto o sarebbe in grado di modificare un indicatore ADR esistente per mostrare i livelli di espansione in base all'intervallo di oggi Come mostrato nello screenshot L'indicatore !SM_ADR sarebbe una buona base per questo perché le proiezioni alto e basso sono livelli dinamici Ma è un indicatore bloccato ma credo che ce ne siano simili che potrebbero essere modificati Grazie {image} In modifica: i livelli percentuali mostrati sono i record storici del prezzo che ha raggiunto quei livelli
Hello
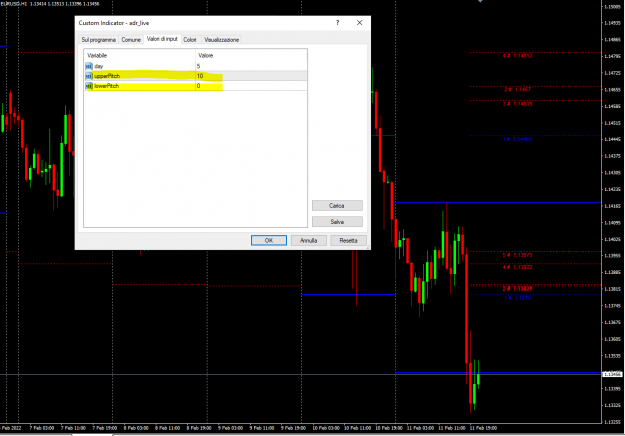
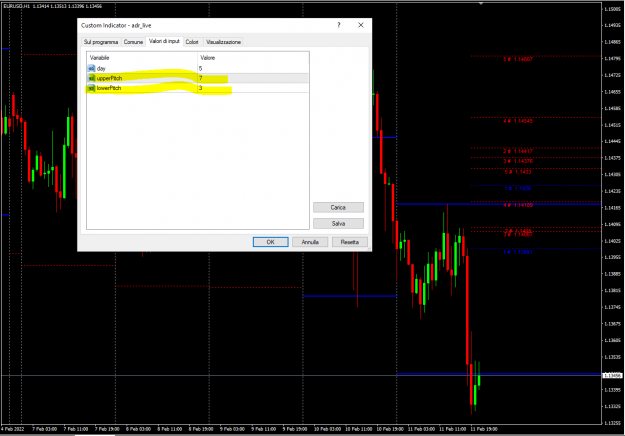
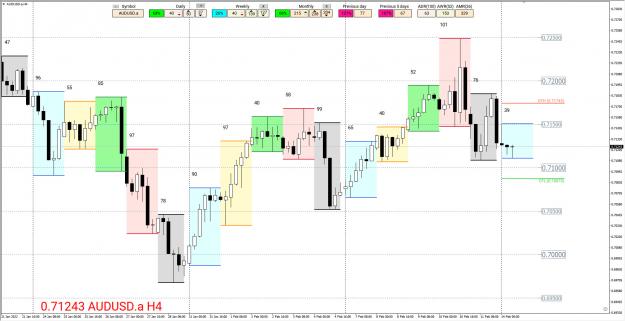
I have entered on the dashboard which level (upper & lower) I want to display.
The levels are calculated by dividing the max & min ADR value by 10.
See attached example.
Erebus posted this ADR indicator in one of my threads and I need to see if someone can make it with a few mods, but all he has is the ex4 file though. It calculates the ADR (14 days default) and draws the ADR high and low on the chart. At 00:00 GMT the indicator recalculates and redraws new ADR highs and lows for the current day. I want to have the indicator to leave the previous day's high/low ADR values on the charts being able to go back "X" number of days. Can anyone make up one from scratch or modify one the might already have? {file}
I want to have the indicator to leave the previous day's high/low ADR values on the charts being able to go back "X" number of days. Can anyone make up one from scratch or modify one they might already have? {file}
Ignored
The previous post and chart by ServerUang made me go back and read the original request much closer.
Where you say "previous day's high/low ADR values" do you mean that day's range or the ADR on that day?
I use an ADR value of 100 so I don't expect the ADR value to change much from day to day.
The range of the day is another thing however, it can be high, it can be low, that's how you get an average.
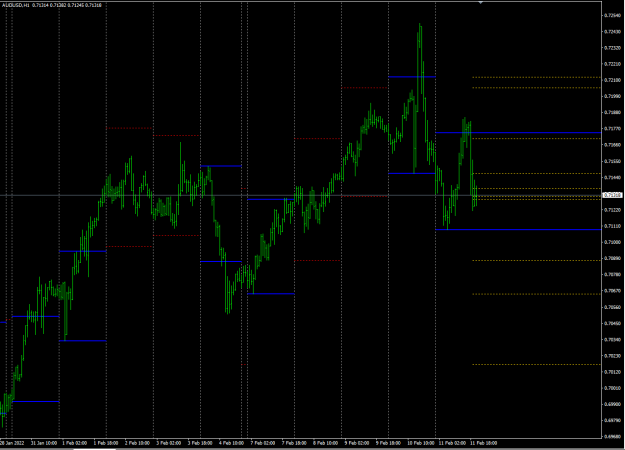
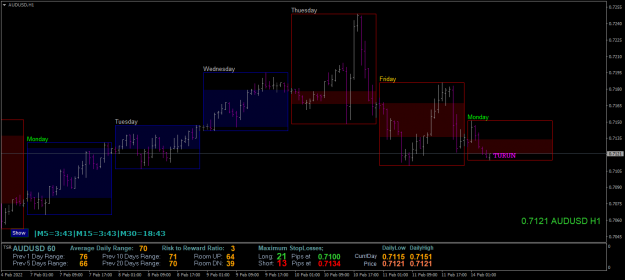
I use Daily Line Boxes to show the previous days' ranges as in this chart below.
Attached Image (click to enlarge)
If you trade like me, you'll be homeless and broke within a week.
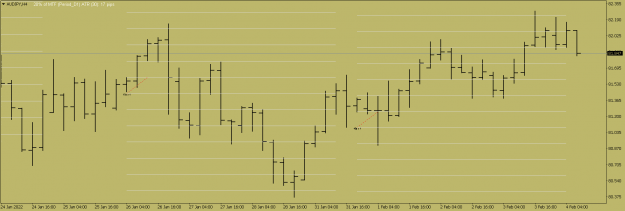
This indicator can be configured to generate rows. PIPS line spacing does not change when switching time frames. For example, 0.2 ATR number of periods 30 TF D1. Does anyone have a better idea for creating such levels?
{quote} The previous post and chart by ServerUang made me go back and read the original request much closer. Where you say "previous day's high/low ADR values" do you mean that day's range or the ADR on that day? I use an ADR value of 100 so I don't expect the ADR value to change much from day to day. The range of the day is another thing however, it can be high, it can be low, that's how you get an average. I use Daily Line Boxes to show the previous days' ranges as in this chart below. {image}
Ignored
Do u have this ADR displayed in chart? Please share
{quote} The previous post and chart by ServerUang made me go back and read the original request much closer. Where you say "previous day's high/low ADR values" do you mean that day's range or the ADR on that day? I use an ADR value of 100 so I don't expect the ADR value to change much from day to day. The range of the day is another thing however, it can be high, it can be low, that's how you get an average. I use Daily Line Boxes to show the previous days' ranges as in this chart below. {image}