This is a specific template for 15m charts but can be adjusted to fit timeframes up to 1 hour by changing the awesome timeframe to the next upper timeframe.
1m = 5m signal : 5m = 15m signal : 15m = 30m signal : 1hour = 4hr signal.
I think this is really a money making template.
Post any losses with a screengrab to anyone who uses it.
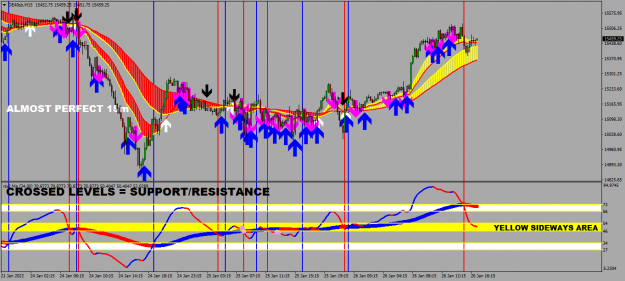
Indicator should tell you when NOT to trade (central yellow area), when to scalp (when there is a huge gap between the fast and slow rsx) and when to follow the trend (slow rsx colour and chart ma's match).
Be patient and trade well.
2TT
Looks good, How long are you trading this? or just starting.. also I noticed some good regular divergences, maybe if you incorporate that signals or it is to much indicators?
Thanks
I cannot trade now – but I have Index traded for many years and I believe this is the best template I have designed. If I were younger I would make money every single week from this template as, to me, it has everything – and as you so astutely mention, divergence.
I thought many eyes and the posting of loss making trades would help everyone using it in a very short time of weeks rather than months.
2TT
I cannot trade now – but I have Index traded for many years and I believe this is the best template I have designed. If I were younger I would make money every single week from this template as, to me, it has everything – and as you so astutely mention, divergence. I thought many eyes and the posting of loss making trades would help everyone using it in a very short time of weeks rather than months. 2TT
This is a specific template for 15m charts but can be adjusted to fit timeframes up to 1 hour by changing the awesome timeframe to the next upper timeframe. 1m = 5m signal : 5m = 15m signal : 15m = 30m signal : 1hour = 4hr signal. I think this is really a money making template. Post any losses with a screengrab to anyone who uses it. Indicator should tell you when NOT to trade (central yellow area), when to scalp (when there is a huge gap between the fast and slow rsx) and when to follow the trend (slow rsx colour and chart ma's match). Be patient...
Ignored
hello to all. Could you please describe what indicators and the ir settings you use? I use different charting tool (Motive Wave).
{quote} All settings are on template and the rsx is the rsi cross indicator. It is up to you whether you use it or not. 2TT
Ignored
I am sorry I do not use the Meta software nor windows, hence I do not know what do you mean by template. If you have the kindness please at least to describe the indicators you use and their settings and those in price chart. Thanks in advance.
{quote} I am sorry I do not use the Meta software nor windows, hence I do not know what do you mean by template. If you have the kindness please at least to describe the indicators you use and their settings and those in price chart. Thanks in advance.
Ignored
This is a metatrader 4 system so it cannot be suitable for you. Sorry.
2TT
@ 2teamtraders...
thanks for providing indicators and templates for MT4.
A little question: why did you make this good thread in the Platform Tech section, not in the Thrading System section?
@ 2teamtraders... thanks for providing indicators and templates for MT4. A little question: why did you make this good thread in the Platform Tech section, not in the Thrading System section? ServerUang
Ignored
It was originally on Trading Systems but the Administrator has moved it to here - I do not understand either!
2TT
My compliments. Very intersting Template.
Some questions:
- why 15 min chart is valid as signal on 30 min. and so on ? or for both, that is valid for 15 and 30 Min chart ?
- sometimes the price is already very far from arrow. Have I to wait that the price goes back (retests)
the proce stated from arrow or not ?
- is it possible to adopt this template also on higher TF ? (day, week, Month)
{quote} This is a metatrader 4 system so it cannot be suitable for you. Sorry. 2TT
Ignored
Tnx for the tmpl. looking good indeed, I remember the time you post similar ideas on forex station way back, even remember the time when you were all head around tma nrp :-), but anyway, if you said this is your best creation till now with no doubt it is true. Any hints about particular tmpl. or it is like you said in the first post. Thank you once again and hope your health will be better
My compliments. Very intersting Template. Some questions: - why 15 min chart is valid as signal on 30 min. and so on ? or for both, that is valid for 15 and 30 Min chart ? - sometimes the price is already very far from arrow. Have I to wait that the price goes back (retests) the proce stated from arrow or not ? - is it possible to adopt this template also on higher TF ? (day, week, Month) Thank you very much
Ignored
Because the setting of Awesome signal is on 'newest bar of higher timeframe' it will flash on and off till it is confirmed. If the setting was changed to false then it will be delayed to the upper timeframe completion of the candle.
Everyone trades differently so I cannot offer advice on how to trade as 'my eyes' may be completely different to your trading eyes.
2TT
{quote} Tnx for the tmpl. looking good indeed, I remember the time you post similar ideas on forex station way back, even remember the time when you were all head around tma nrp :-), but anyway, if you said this is your best creation till now with no doubt it is true. Any hints about particular tmpl. or it is like you said in the first post. Thank you once again and hope your health will be better
Ignored
Thanks - as I said above, different traders look for different trades - me I scalp and would be happy with 3 or 4 trades a day with a target of 5 or more per trade. However, I know other traders who are more patient and take more risk and get more out of the day but that is not my way. The template seems to me to be really good for most type of trading - scalping, swing, trending etc.
2TT
Looks good, How long are you trading this? or just starting.. also I noticed some good regular divergences, maybe if you incorporate that signals or it is to much indicators? Thanks
Ignored
I only see arrows and lots of colors total nonsense to me
Learn to trade price action and you don't need all this nonsense
{quote} I only see arrows and lots of colors total nonsense to me Learn to trade price action and you don't need all this nonsense
Ignored
Yes, it is nonsense to you, because I think you are stationed ONLY in price action, you can't see above the Trees!, Old School maybe... I know all that.. but.. Easy money, without hard work is better for me...
Regards
{quote} Yes, it is nonsense to you, because I think you are stationed ONLY in price action, you can't see above the Trees!, Old School maybe... I know all that.. but.. Easy money, without hard work is better for me... Regards
Ignored
but theres ways the trade smarter and not harder with out a rainbow chart. one or two accurate calculations could do the same job
I'm fine, I trade the easiest way, not the smarter way.. winning much more than the losing ones, remember that all of us have a different background and resources, also.. always trying to learn new tricks..... really I don't need a new method, but I'm curious... and I appreciate the effort of some people to serve..
Thanks 2teamtrader..
Quote
Disliked
but theres ways the trade smarter and not harder with out a rainbow chart. one or two accurate calculations could do the same job
I'm fine, I trade the easiest way, not the smarter way.. winning much more than the losing ones, remember that all of us have a different background and resources, also.. always trying to learn new tricks..... really I don't need a new method, but I'm curious... and I appreciate the effort of some people to serve.. Thanks 2teamtrader.. {quote} Could you tell us your method?, ....
Ignored
Sorry - got distracted.
1. wait for arrows and vertical line to all be in the same direction. Always trade in the direction of indicators - NEVER scalp against the prevailing trend.
2. check RSx position - with white area being the exit/target.
3. Price must be clear of ma's on chart.
Does that help?
2TT