The indicator uses the most prominent calculation techniques like Classical, Camarilla, Woodie, Fibonacci, and CPR to generate crucial Pivot Levels in the MT4 terminal automatically.
For MT4, it's arguably one of the greatest Pivot indicators. You can also download it for free without having to register.
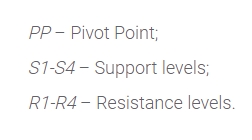
Features of Pivot Points indicator
Pivot’s point indicator features a prior day’s range, and tells you that the price is likely to reach yesterday’s closing point. So, the calculation indicator uses is for the daily price data.
All Pivot levels serve both support and resistance in this situation.
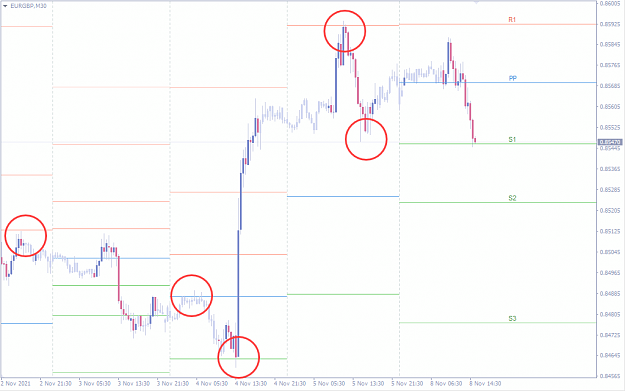
When you see the indicator levels, we can detect various price movements. One of the features of Pivots point indicator is the more you use the indicator, the more price interaction will become clearer.
Calculation Modes and Formulas
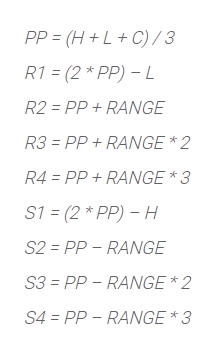
For calculating levels, you can use HIGH (H), LOW (L), and CLOSE (C) for the previous period; generally, it is a day, week, month, or hour.
While you calculate Pivots, the concept of RANGE (R) is also applied. You can determine its value by the formula: H – L.
You should also take into account the differences between the forex and stock markets.
Pivot levels were first applied in the stock market, where the previous day's closing price is extremely important and has a considerable impact on traders' psychological behavior the following day.
On the other hand, Forex operates around the clock; thus, the end of one trading day corresponds with the start of the next.
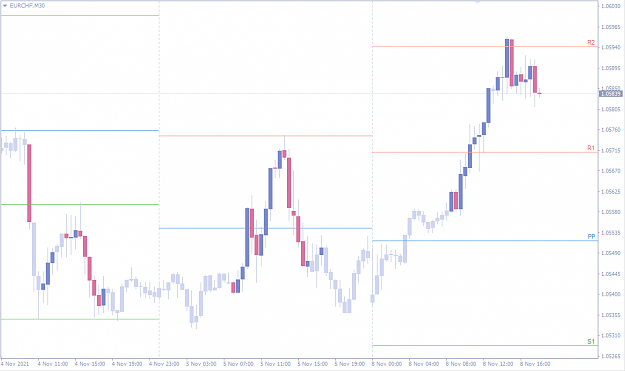
Classic (Floor)
It is the most common method for calculating Pivot Points. The main (blue) line here defines the role of a key support/resistance level.
Camarilla
Camarilla levels are somewhat closer to the present price; therefore, interactions with them happen more frequently. Therefore, this method is appropriate for people who engage in short-term trading.
A key point to add here is that the PP formula differs from the well-known Camarilla approach in a few ways. First, we've adjusted the calculation because the conventional method provides a level that doesn't match the logic of other support and resistance levels.
Woodie
This method is identical to the original one, except when computing the basic PP line, we emphasize the period's closing price.

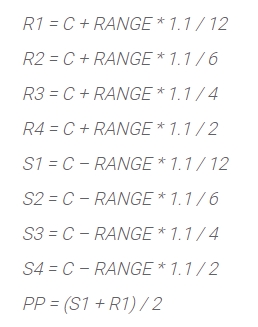
Fibonacci
Traders often use the Fibonacci numbers in the forex market. Pivot Points are no different. The resistance and support levels are calculated using this approach by multiplying the range (R) by the relevant Fibonacci numbers.

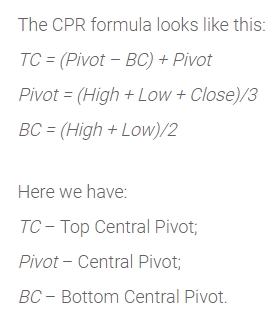
Central Pivot Range (CPR)
It's a more evolved version of the traditional Pivot Point calculations. This indicator is unique in that it lacks support and resistance levels. The Central Pivot Range comprises three pivot lines: a central one and upper and lower bounds.
CPR helps you in predicting future market conditions by analyzing whether pivots are higher or lower over time or if range breadth is narrowing or expanding.
If CPR is narrow for several days, it typically suggests a large breakout or breakdown in the near future. On the flip side, if the market closes above the day's CPR, it might be a hint of optimistic tendencies for the next day.
Which of these approaches for calculating Pivot Points is the most effective?
There is no such thing as the best or worst way. In truth, any of them can work, and you should choose one depending on your trading views.
Indicator settings
The indicator is formatted as an "All in One" indication. As we tried our best to integrate all of the most common functionalities in this MT4 indicator, you may adjust it to your liking.
If you have any specific requests or suggestions for improvements, please contact us, and we will gladly consider them.

Calculation Method – You need to select the method of Pivot Points calculation: Classical, Camarilla, Woodie, and Fibonacci. We've already mentioned formulas for each one of the above.
Calculation Period – It defines the period for which the High, Low, Close values will be taken.
Available periods:
- Hourly;
- Daily;
- Weekly;
- Monthly.
Number of Periods to show–It is several previous periods to be displayed on the chart. This parameter is not considered if the option "Show only the current period" is set.
Show Only Recent Period–It displays one or more calculation periods.
Depth of Levels – It limits the number of displayed support and resistance lines on the chart.
Right Shift–suggests continuing the line to the full length of the right indent on the chart.
Color Scheme – You can use it for automatic navigation of the color scheme. You can also change the background color manually for the indicator.
Indicator installation
Download Link
1. Download and unzip the archive to the MQL4 folder of the terminal;
2. Restart the terminal and run the indicator;
3. Allow import of DLLs.