Anchored volume-weighted average price or simply AVWAP is a previous meaningful benchmark price on a chart chosen by traders that quantifies the average price a market has traded at through a time period, based on both volume and price. This metric is important because it provides traders with a visual of the nature of the trend and the average technical value of a stock from a defined starting point.
The theory behind the anchored VWAP is like much technical analysis is that charts have memory based on past key levels of transactions. Old resistance can become new support as traders that missed the breakout buy their second chance to get in at that price as one example. A lot of price action happening at one price level can create new price action based on memory in the future based on an anchoring bias. People that missed a gap breakout may want to buy when the price pulls back to the initial level of the gap...
The VWAP line shows one line on a chart anchored to a chosen starting point and can be for any timeframe. Some traders use the VWAP as one filter for their trend trading rules. It has become a popular tool for many day traders on intraday charts.
The formula for the anchored VWAP is calculated by starting at the chosen benchmark and adding together the total dollars traded in a market for all the transactions and then dividing the total dollars by the total shares traded. The Anchored VWAP line on a chart shows the quantified volume-weighted average price for a time period, beginning from a chosen starting point. This calculation is represented as a line on the chart that moves and adjusts to new information as it is created.
Here are key areas that an anchored VWAP can start its calculations from these starting points inside a timeframe:
- Highest Volume
- Highest High
- Lowest Low
- Recent Gap
- Day to date
- Week to date
- Month to date
- Quarter to date
- Year to date
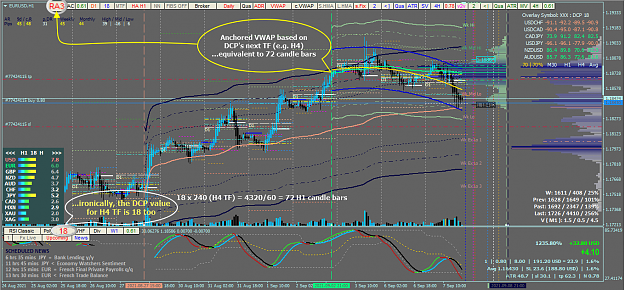
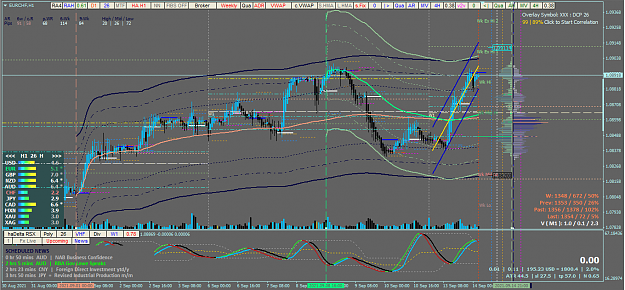
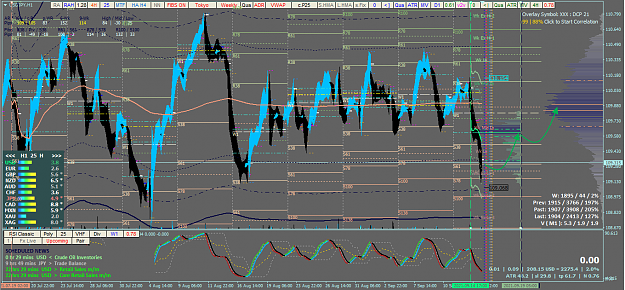
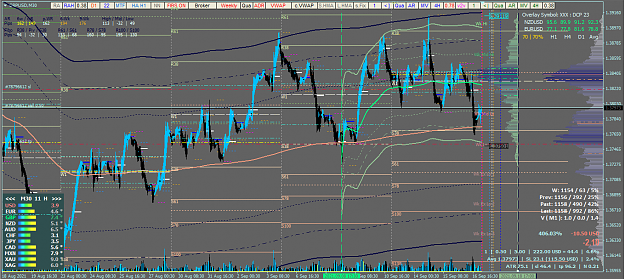
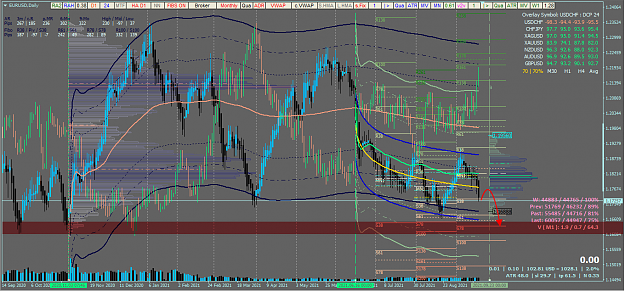
Attached Image (click to enlarge) 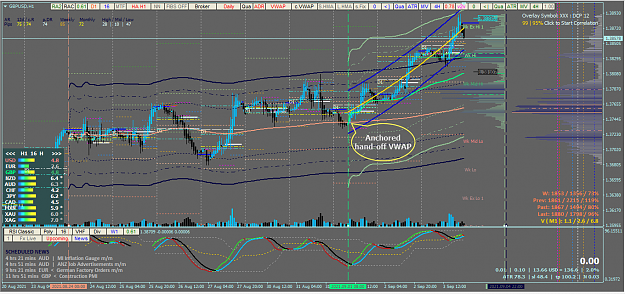
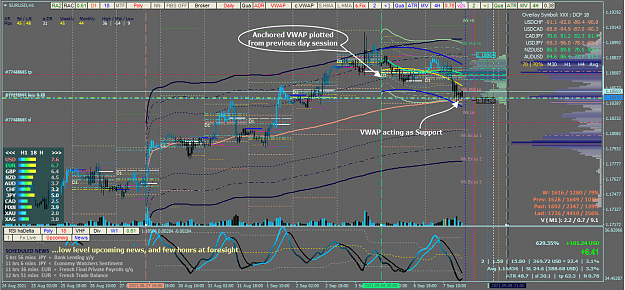
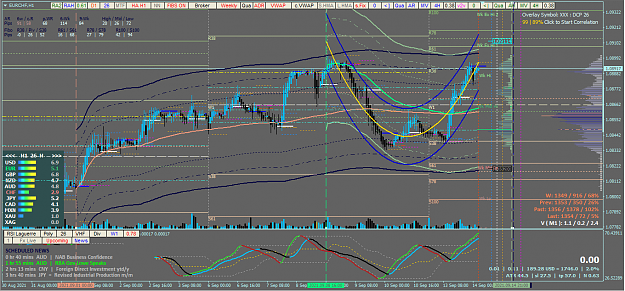
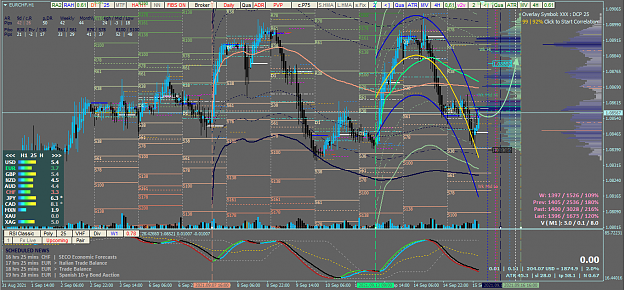
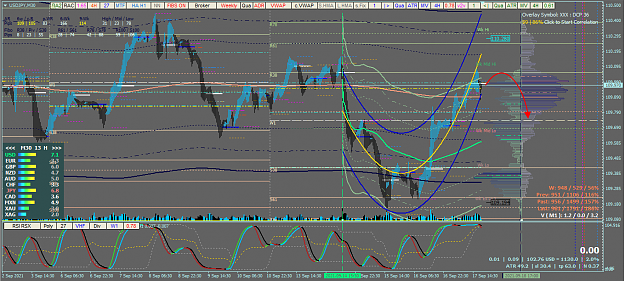
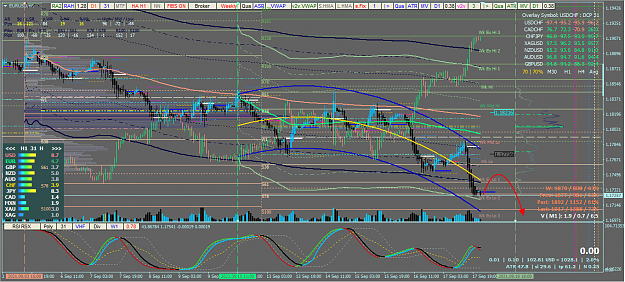
Attached Image (click to enlarge) 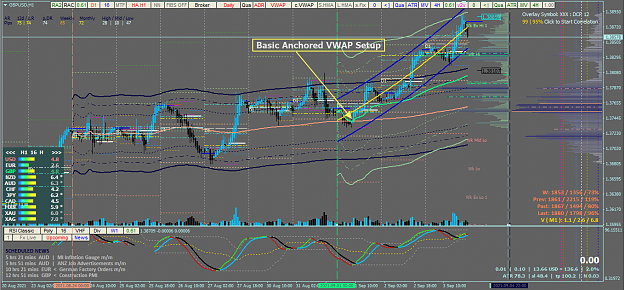
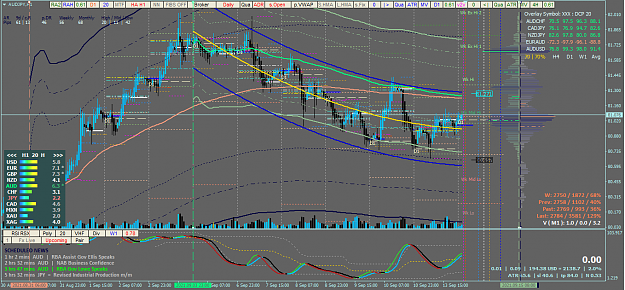
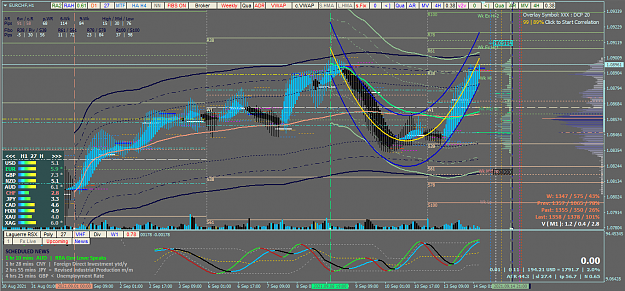
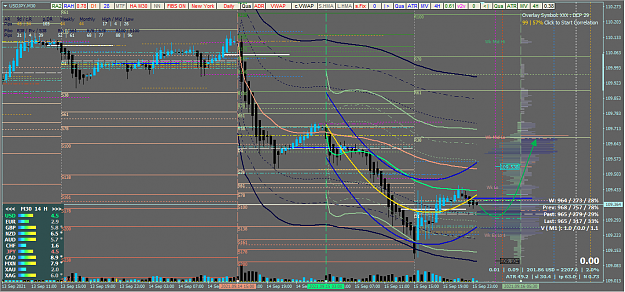
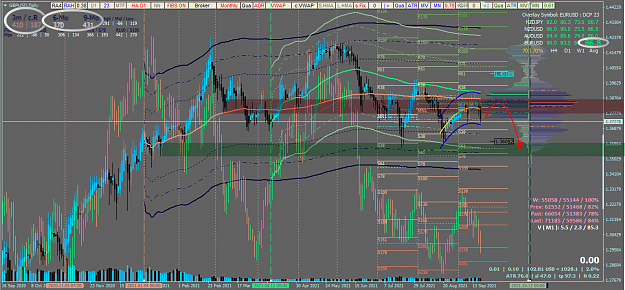
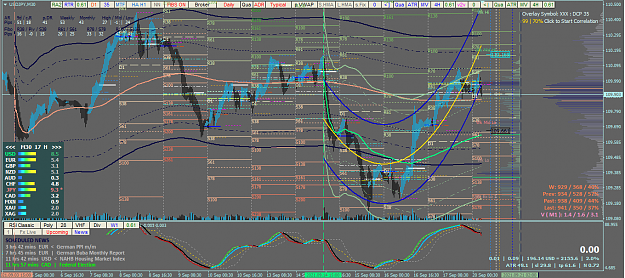
Attached Image (click to enlarge) 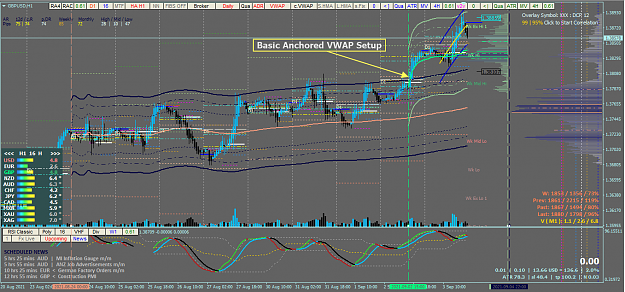
Anchored VWAP concept video...
Inserted Video
Since Frank Sinatra sings in his own way, my chart sing... I did it, my way