• Home
  • Forums
  • News
  • Calendar
  • Market
  • Login
  • Join
  • User/Email: Password:
  • 11:04am
Menu
  • Forums
  • News
  • Calendar
  • Market
  • Login
  • Join
  • 11:04am
Sister Sites
  • Energy EXCH
  • Crypto Craft
  • Forex Factory

Options

Bookmark Thread

First Page First Unread Last Page Last Post

Print Thread

Similar Threads

The Really Useful Grains/Soft Thread 233 replies

233 tick charts for grains 4 replies

pivot points for grains markets 0 replies

Grains/Food Shortages 2 replies

Grains & Agricultural Futures 20 replies

  • Commercial Content
  • /
  • Reply to Thread
  • Subscribe
  • 638
Attachments: Futures: Energy, Metals, Grains, Soft, Indices, Rates
Exit Attachments

Futures: Energy, Metals, Grains, Soft, Indices, Rates

  • Last Post
  •  
  • 1 1718Page 192021 27
  • 1 18Page 1920 27
  •  
  • Post #361
  • Quote
  • Aug 14, 2021 1:47am Aug 14, 2021 1:47am
  •  blunderbuss
  • | Joined Jun 2008 | Status: Member | 542 Posts
AMENDMENT:
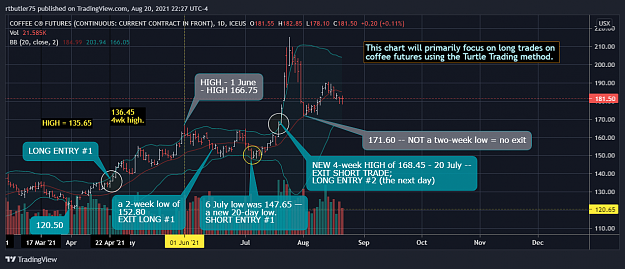
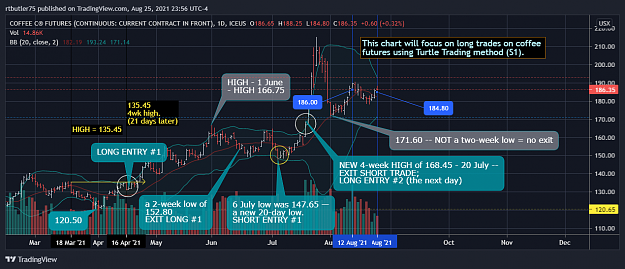
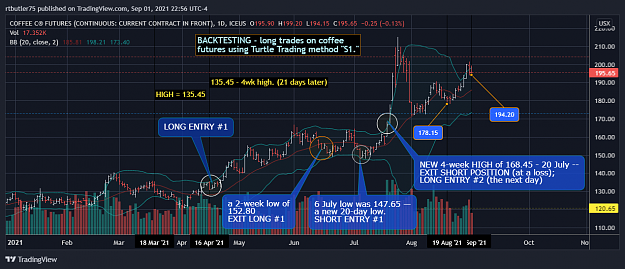
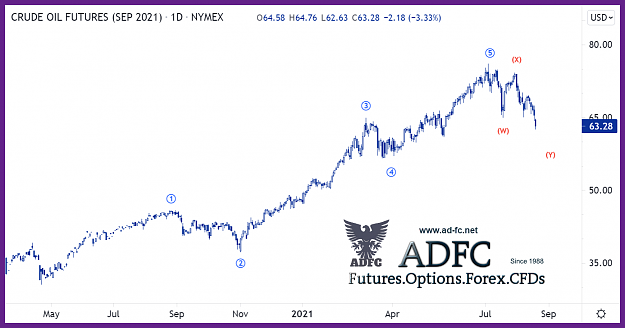
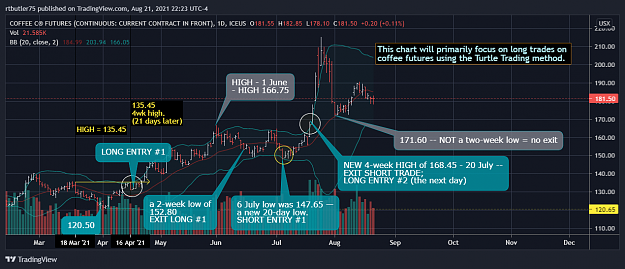
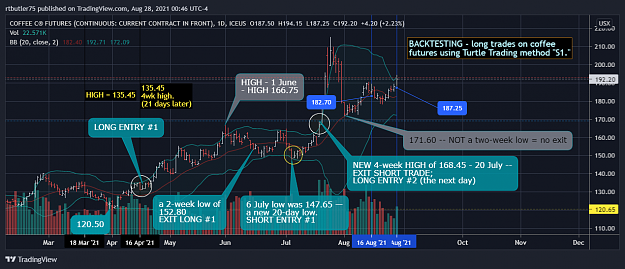
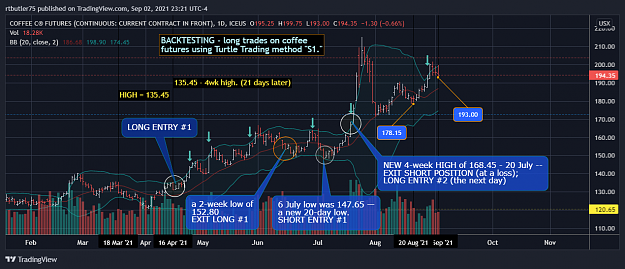
I used June 1st as a starting point for my back-testing.
But if I had entered a long there, I would have exited
at the vertical green line, which marks a new two-week low price.

Attached Image (click to enlarge)
Click to Enlarge

Name: COFFEE FUTURES - KC1 - 2021 08 13, with notes about a 2-week low after June 1.png
Size: 94 KB

Such an exit would have meant a loss, followed by a second
losing trade--a short entry just before the price went long.
But the Turtle Traders stress obedience to the system without
impulsive second-guessing.

So far, an entry after the circled high price is still profitable.

Attached Image (click to enlarge)
Click to Enlarge

Name: FERGIE from BEPeas.jpg
Size: 234 KB
Secrecy is the badge of fraud. -- — Sir John Chadwick
 
1
  • Post #362
  • Quote
  • Aug 17, 2021 10:40pm Aug 17, 2021 10:40pm
  •  blunderbuss
  • | Joined Jun 2008 | Status: Member | 542 Posts
After Tueday's close, the chart looked like this:

Attached Image (click to enlarge)
Click to Enlarge

Name: COFFEE FUTURES - KC1 - 2021 08 17 - still long.png
Size: 112 KB

N.B. I am limiting my focus to going long, although I did point out a four-week low,
which would have been a short entry point (according to the book).

I am hoping the price does not get stuck in a range.

Attached Image (click to enlarge)
Click to Enlarge

Name: NINA DOBREV and her killer legs - red carpet.jpg
Size: 101 KB
Secrecy is the badge of fraud. -- — Sir John Chadwick
 
 
  • Post #363
  • Quote
  • Aug 18, 2021 11:05pm Aug 18, 2021 11:05pm
  •  blunderbuss
  • | Joined Jun 2008 | Status: Member | 542 Posts
After the close of trading on 18 August 2021...

Attachment 4016602
What chart is this? THEICE.com explains...

The Coffee C contract is the world benchmark for Arabica coffee.
The contract prices physical delivery of exchange-grade green beans,
from one of 20 countries of origin in a licensed warehouse to one of
several ports in the U. S. and Europe, with stated premiums/discounts
for ports and growths
.


Attached Image (click to enlarge)
Click to Enlarge

Name: Seungyeon - CLC.jpg
Size: 62 KB
Secrecy is the badge of fraud. -- — Sir John Chadwick
 
 
  • Post #364
  • Quote
  • Aug 19, 2021 12:08pm Aug 19, 2021 12:08pm
  •  Beyfor
  • | Commercial Member | Joined Dec 2012 | 821 Posts
Quoting Beyfor
Disliked
Crude Oil The bullish trend strongly damaged after the opec+ new agreement. {image}{image}
Ignored
CRUDE OIL : THE BULLISH TREND STRONGLY DAMAGED.

Attached Image (click to enlarge)
Click to Enlarge

Name: crude oil sep21 daily 4.png
Size: 107 KB
 
1
  • Post #365
  • Quote
  • Aug 19, 2021 5:40pm Aug 19, 2021 5:40pm
  •  jp-wilkinson
  • | Joined Jul 2021 | Status: Member | 47 Posts
happy with these ones today #classicdaypivots JP225 + SP500
Attached Images (click to enlarge)
Click to Enlarge

Name: [JP225]-ECNH1.png
Size: 32 KB Click to Enlarge

Name: [SP500]-ECNH1.png
Size: 31 KB
 
 
  • Post #366
  • Quote
  • Aug 19, 2021 11:44pm Aug 19, 2021 11:44pm
  •  blunderbuss
  • | Joined Jun 2008 | Status: Member | 542 Posts
In this backtesting scenario,
we have still not reached our exit signal: a two-week low on the daily charts.
So we would still be long (if this were a real trade).

Attachment 4017694
I recently read this week that the pullback in the coffee rally was due to "concerns"
about unseasonably cold weather in Brazil.

Arabica Coffee Slips With Traders Weighing Brazil Frost Risk

Attached Image
Secrecy is the badge of fraud. -- — Sir John Chadwick
 
1
  • Post #367
  • Quote
  • Aug 20, 2021 10:34pm Aug 20, 2021 10:34pm
  •  blunderbuss
  • | Joined Jun 2008 | Status: Member | 542 Posts
What a difference a day makes! Now that I've been experimenting
with the tools on TradingView (my shameless plug for my charting
website), I've cleaned up my chart and expanding the scope of the
back-testing.

Now it's easier to see where the entry and exit points are.

Attached Image (click to enlarge)
Click to Enlarge

Name: COFFEE FUTURES - KC1 - 2021 08 20 - redesigned chart - much nicer - still long.png
Size: 135 KB

I've now moved my starting point to the low of 31 March 2021,
which was 120.50.
Secrecy is the badge of fraud. -- — Sir John Chadwick
 
 
  • Post #368
  • Quote
  • Aug 21, 2021 10:28pm Aug 21, 2021 10:28pm
  •  blunderbuss
  • | Joined Jun 2008 | Status: Member | 542 Posts
AMENDMENT/CORRECTION:
I wasn't sure if I was following the system right, so I went and got out the
Google Sheets page and wrote out all the OHLC numbers from 17 Mar 2021
to the start of the chart. I wanted to be sure that I was getting the right
entry points for long/short trades.

Sure enough, I found that the price of $135.45 was reached again at
exactly 21 trading days after 17 March--16 April. That signals the
start of a new long trend, and we are supposed to enter a trade the next day
(i.e., April 17).

Attached Image (click to enlarge)
Click to Enlarge

Name: COFFEE FUTURES - KC1 - 2021 08 20 - REVISED - new long entry no. 1.png
Size: 138 KB
Secrecy is the badge of fraud. -- — Sir John Chadwick
 
 
  • Post #369
  • Quote
  • Aug 21, 2021 10:32pm Aug 21, 2021 10:32pm
  •  blunderbuss
  • | Joined Jun 2008 | Status: Member | 542 Posts
And, because it seems you can't have two images in one post,
or it'll use up too much memory, here is the requisite girlie pic.

Attached Image (click to enlarge)
Click to Enlarge

Name: Jenny-McCarthy-Nude-Sexy-TheFappeningBlog.com-132-1024x768.jpg
Size: 29 KB
Secrecy is the badge of fraud. -- — Sir John Chadwick
 
 
  • Post #370
  • Quote
  • Aug 24, 2021 12:00am Aug 24, 2021 12:00am
  •  blunderbuss
  • | Joined Jun 2008 | Status: Member | 542 Posts
Last Friday's low was 178.10 but was not an exit signal.
Out of the previous ten trading days, it was not a new low.

Attachment 4020192

There were in fact two lower prices: one is labeled on the map
(172.45). The OHLC candle after that still has a low of 177.55,
which is .55 lower than our 10th day candle.

After Monday's trading, the Aug. 9th candle is no longer
within the two-week trading range. The one for August 10th
is our lowest low, and it is not a fresh low. We would still be long.
Secrecy is the badge of fraud. -- — Sir John Chadwick
 
 
  • Post #371
  • Quote
  • Aug 25, 2021 12:38am Aug 25, 2021 12:38am
  •  blunderbuss
  • | Joined Jun 2008 | Status: Member | 542 Posts
After trading: Tuesday, August 24th:

Attached Image (click to enlarge)
Click to Enlarge

Name: COFFEE FUTURES - KC1 - 2021 08 24 - not a 10-day low - still long.png
Size: 143 KB

I put two flags that mark the low prices for today (the 24th) and two weeks earlier.
Neither one represents a "new two-week low," so we are still long in this hypothetical
trade.
Secrecy is the badge of fraud. -- — Sir John Chadwick
 
 
  • Post #372
  • Quote
  • Aug 25, 2021 10:26am Aug 25, 2021 10:26am
  •  Beyfor
  • | Commercial Member | Joined Dec 2012 | 821 Posts
GOLD Medium/Long term outlook


Attached Image (click to enlarge)
Click to Enlarge

Name: gold weekly 20.png
Size: 258 KB
 
1
  • Post #373
  • Quote
  • Aug 25, 2021 11:58pm Aug 25, 2021 11:58pm
  •  blunderbuss
  • | Joined Jun 2008 | Status: Member | 542 Posts
WEDNESDAY, AUGUST 25: Stagnant.

Attached Image (click to enlarge)
Click to Enlarge

Name: COFFEE FUTURES - KC1 - 2021 08 25 - stagnant.png
Size: 143 KB

Well, the Turtles didn't promise excitement EVERY day...
Secrecy is the badge of fraud. -- — Sir John Chadwick
 
 
  • Post #374
  • Quote
  • Aug 28, 2021 12:48am Aug 28, 2021 12:48am
  •  blunderbuss
  • | Joined Jun 2008 | Status: Member | 542 Posts
Friday's close: 2021 08 27

N.B. In the Turtle Trading book that I'm using, there is a reference to a
filter rule that might change the way people look at this chart:

The Turtles ignored the System One four-week breakout signal if the
last four-week breakout signal was a winner. Even if they did not take
the last four-week breakout signal, or even if it was just "theoretically"
a winning trade, the Turtles still didn't take the System One breakout.
However, if the trade before a current four-week breakout was a 2N loss,
they could take the breakout ("N" was simply their measure of volatility,
discussed in the next section).

Since I haven't been keeping a chart of "N" yet for KC1, I will not dwell
on this yet.

Attached Image (click to enlarge)
Click to Enlarge

Name: COFFEE FUTURES - KC1 - 2021 08 27 - mention of the filter rule.png
Size: 147 KB
Secrecy is the badge of fraud. -- — Sir John Chadwick
 
 
  • Post #375
  • Quote
  • Aug 28, 2021 12:49am Aug 28, 2021 12:49am
  •  blunderbuss
  • | Joined Jun 2008 | Status: Member | 542 Posts
Have a good weekend!

Attached Image (click to enlarge)
Click to Enlarge

Name: houston-texans-cheerleaders-ap_242178052252jpg.jpg
Size: 126 KB
Secrecy is the badge of fraud. -- — Sir John Chadwick
 
 
  • Post #376
  • Quote
  • Aug 30, 2021 9:35pm Aug 30, 2021 9:35pm
  •  blunderbuss
  • | Joined Jun 2008 | Status: Member | 542 Posts
Monday, August 30, 2021.

The high price reached 200.20 on my chart today.
Attached Image (click to enlarge)
Click to Enlarge

Name: COFFEE FUTURES - KC1 - 2021 08 30 - price approaches  $200.00.png
Size: 143 KB

We are still long in this hypothetical trade.
Secrecy is the badge of fraud. -- — Sir John Chadwick
 
 
  • Post #377
  • Quote
  • Aug 31, 2021 12:33pm Aug 31, 2021 12:33pm
  •  Beyfor
  • | Commercial Member | Joined Dec 2012 | 821 Posts
SILVER

Attached Image (click to enlarge)
Click to Enlarge

Name: silver daily 44.png
Size: 160 KB
 
 
  • Post #378
  • Quote
  • Sep 1, 2021 11:01pm Sep 1, 2021 11:01pm
  •  blunderbuss
  • | Joined Jun 2008 | Status: Member | 542 Posts
Wednesday, Sept.1/2021:

Attached Image (click to enlarge)
Click to Enlarge

Name: COFFEE FUTURES - KC1 - 2021 09 01 - still long, close 195.65.png
Size: 141 KB

We are still long in this hypothetical, back-tested trade.

The two vertical black lines are ten trading days apart.
When you include weekdays, that's two weeks. If a new low
occurred on the 10th day, that would be a signal to exit
our long position.
Secrecy is the badge of fraud. -- — Sir John Chadwick
 
 
  • Post #379
  • Quote
  • Sep 1, 2021 11:04pm Sep 1, 2021 11:04pm
  •  blunderbuss
  • | Joined Jun 2008 | Status: Member | 542 Posts
Attached Image (click to enlarge)
Click to Enlarge

Name: VALISERE - fave - fedora, cigar, pink lingerie.jpg
Size: 284 KB
Secrecy is the badge of fraud. -- — Sir John Chadwick
 
 
  • Post #380
  • Quote
  • Sep 2, 2021 11:42pm Sep 2, 2021 11:42pm
  •  blunderbuss
  • | Joined Jun 2008 | Status: Member | 542 Posts
Thursday Sept. 2/2021: Green arrows indicate "Sell and Sell Short" entries...

Attached Image (click to enlarge)
Click to Enlarge

Name: COFFEE FUTURES - KC1 - 2021 09 02 - arrows mark swing trade short sell points..png
Size: 142 KB

One of my favorite books on trading is a "how-to" guide on trading by Dr. Alexander Elder
called Sell and Sell Short. If I had to summarize his approach, I would use this sentence
from Investopedia, which categorizes him as a "swing trader":


  1. Swing traders generally trade within ranges, buying at support levels
  2. and selling at resistance levels. Their trades usually last for the short-term.

In his book, Elder uses Bollinger Bands (among other indicators) to give the trader an idea
of where the support and resistance levels are. IIRC, the trader is supposed to buy when
the price pierces the lower Bollinger band, and exit (or sell short) when the price hits or
surpasses the upper band.

For comparison's sake, I added long greenish arrows pointing to places where one is
supposed to go short using swing trading. Some of those trades would be profitable,
based on the fact that they seem to retrace to the middle of the price range. But the
trade on the 20th of July would see the trader getting stopped out at a loss.

Secrecy is the badge of fraud. -- — Sir John Chadwick
 
 
  • Commercial Content
  • /
  • Futures: Energy, Metals, Grains, Soft, Indices, Rates
  • Reply to Thread
    • 1 1718Page 192021 27
    • 1 18Page 1920 27
0 traders viewing now
  • More
Top of Page
  • Facebook
  • Twitter
About MM
  • Mission
  • Products
  • User Guide
  • Blog
  • Contact
MM Products
  • Forums
  • Calendar
  • News
  • Market
MM Website
  • Homepage
  • Search
  • Members
  • Report a Bug
Follow MM
  • Facebook
  • Twitter

MM Sister Sites:

  • Energy EXCH
  • Crypto Craft
  • Forex Factory

Metals Mine™ is a brand of Fair Economy, Inc.

Terms of Service / ©2022