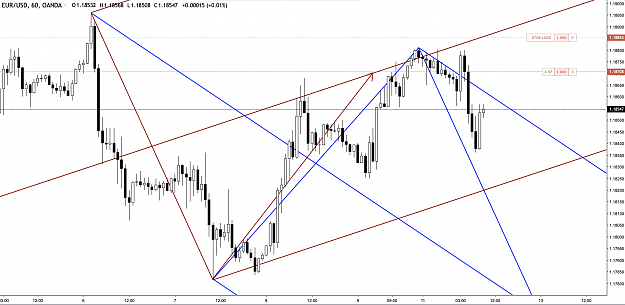
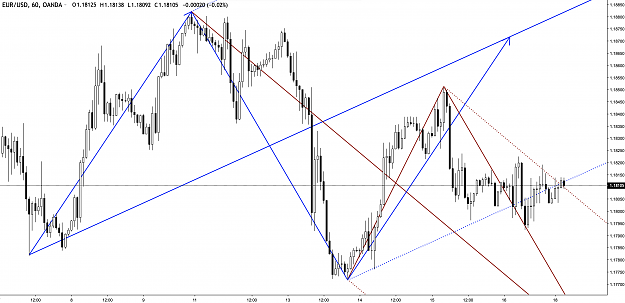
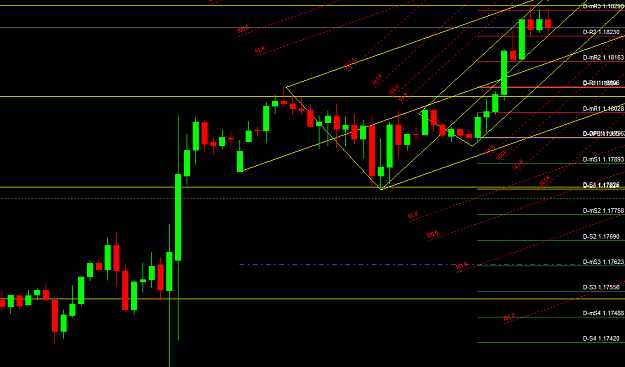
DislikedEURUSD 60 min chart. The 60 minute time frame shows a rather relentless down trend that began in May 2021. Currently it is in a correction and given the trend it seems reasonable to expect further downside. The chart below shows the current median line drawn as a corrective ML. With the current corrective leg price has satisfied the projection so any traders who bought up to this point were rewarded. While further upside can't be ruled out I'll be looking for price action to the downside suggesting the beginning of a new impulse leg. {image}Ignored
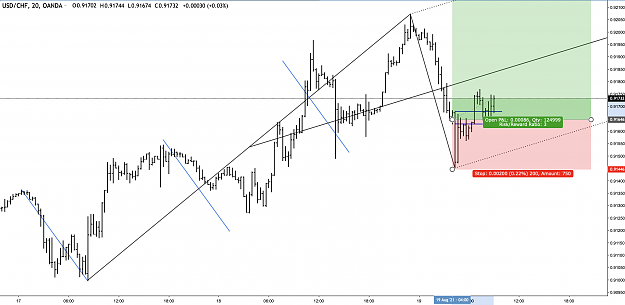
Bearish price action appeared and provided a sell opportunity.
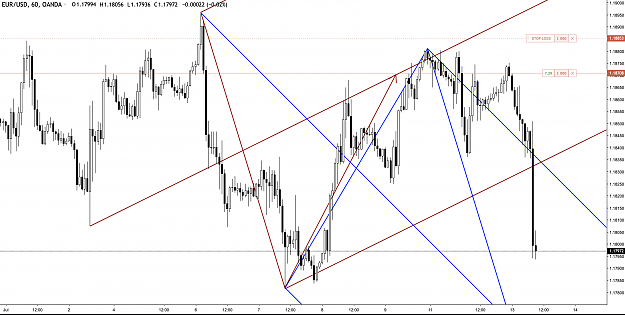
The blue fork suggests a target further down but this is probably a bit ambitious. Target determination yet to come.
Attached Image (click to enlarge)