BREAKDOWN:
This is an aggressive, very accurate, highly profitable scalping strategy.
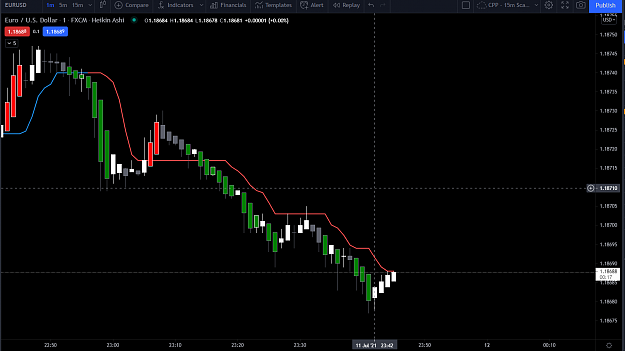
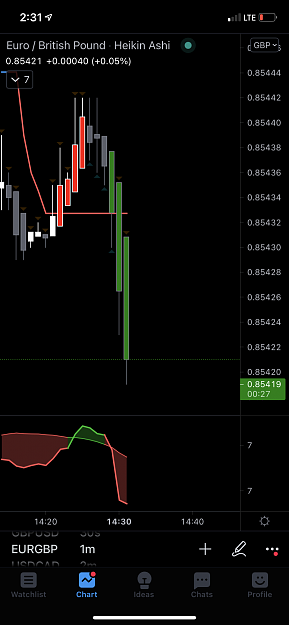
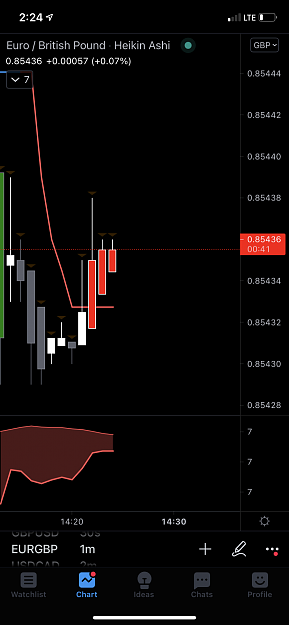
Chart Setup: Heikin Ashi Candles. 1 Minute Time Frame. Make your bars on your chart something neutral , something that's not Green/Red, as our Sigma A indicator makes the bars green and red.
There's two Indicators:
Sigma A: Entry condition based on oversold and overbought conditions. This tool will change your bars colors based on oversold or overbought conditions. (Red = Overbought - Looking for short entries) (Blue = Oversold - Looking for long entries)
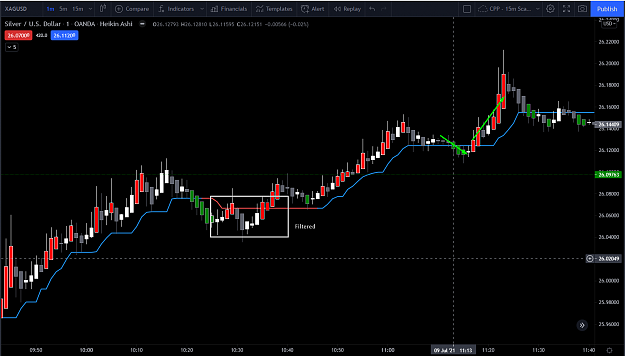
Sigma B Filter that's based on short term trend conditions. This tool will print a line either blue or red that calculates whether the current short term market condition is bullish or bearish:
When Sigma B line is blue we only to go long. When Sigma B line is red we only look to go short.
Trade Setup for Entries (Long)
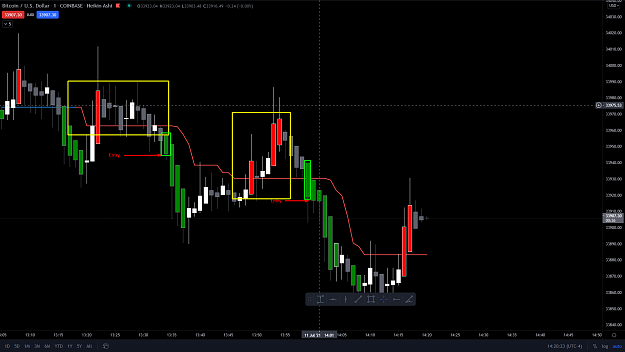
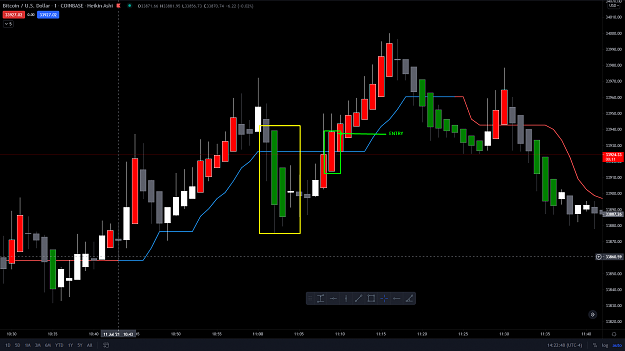
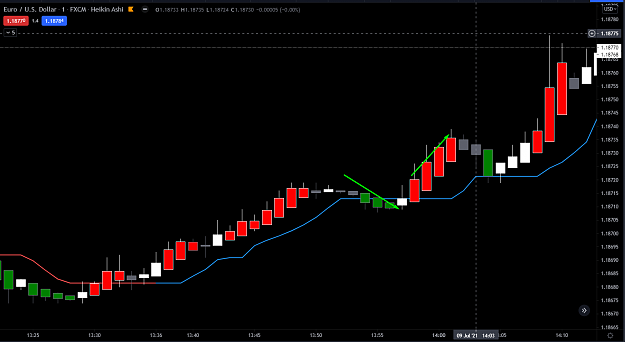
Sigma B Line is BLUE. Wait for Price to drop below Sigma B Line. As Price is dropping below line you should see the bars change to GREEN. This means there's enough buying power for a potential entry.
Your chart bars should now be GREEN AND price is below the BLUE . Now we wait for price to cross the LINE AND the color of the bar that crossed should now be RED.
If Price has crossed the Sigma B line and all prior conditions are true then enter the trade.
Risk Management: Personal style.
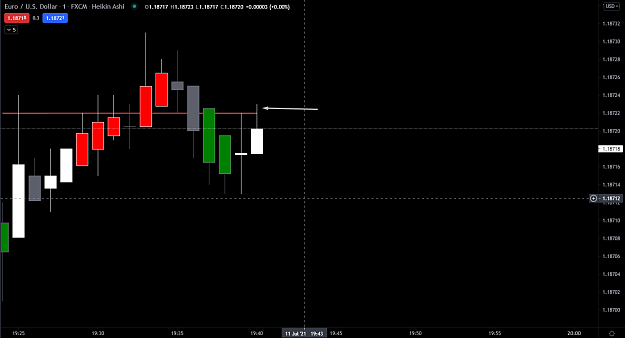
Everyone has their own personal exit strategies when it comes to trading. There's no one size fits all here. Generally, the faster you can make your profit and get out the better. You could also wait for a HA indecision candle
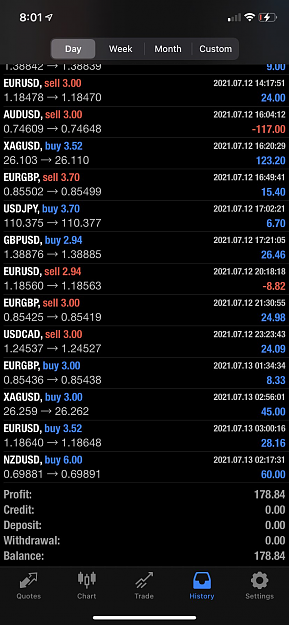
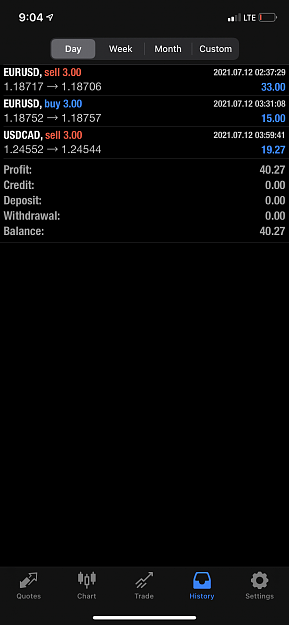
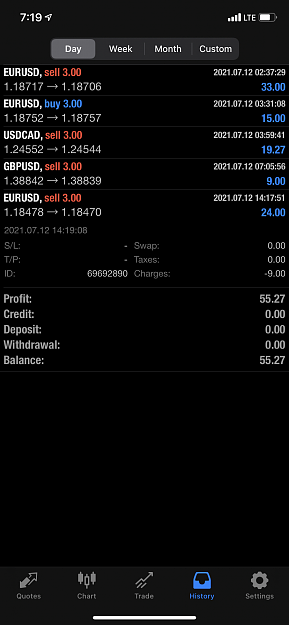
I trade large lot sizes and exit very quickly. I've been trading FOREX and Crypto and it's been honestly insane. Remember...This is SCALPING. In and out.
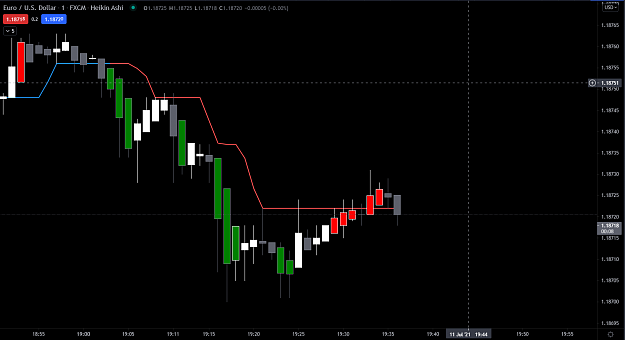
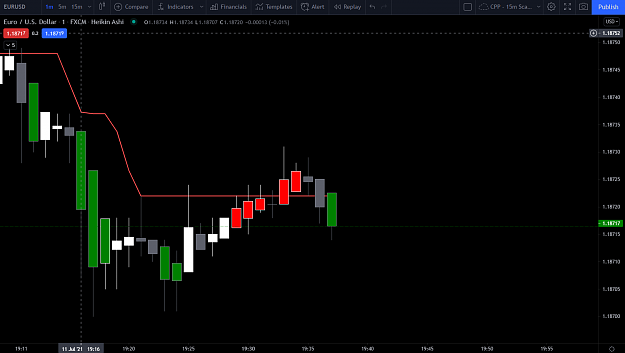
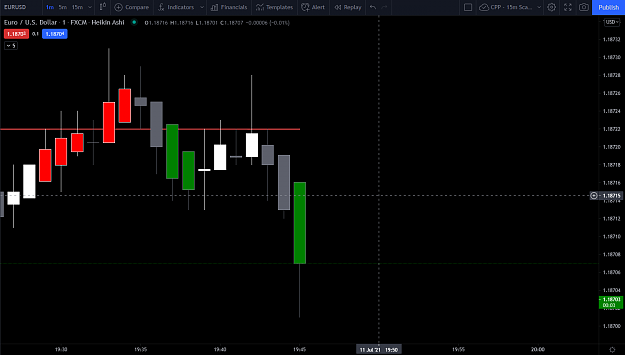
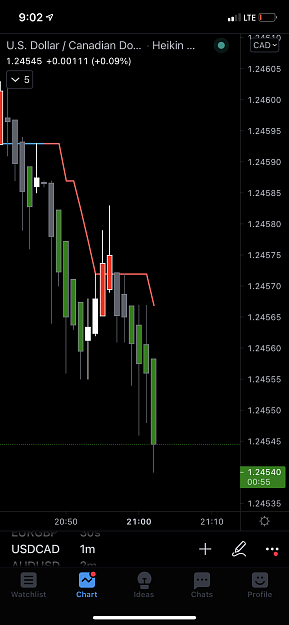
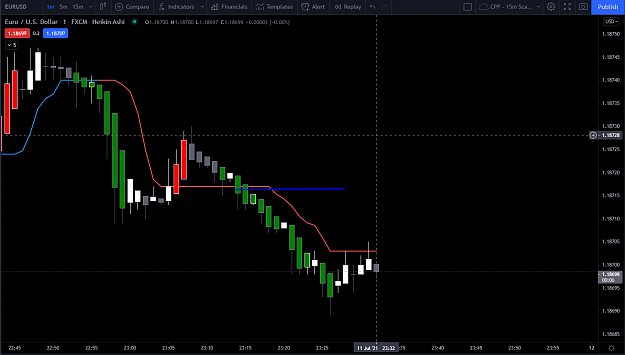
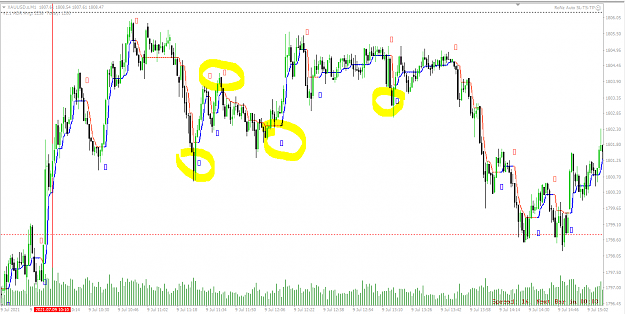
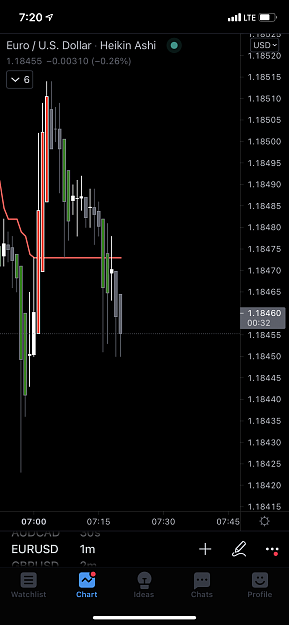
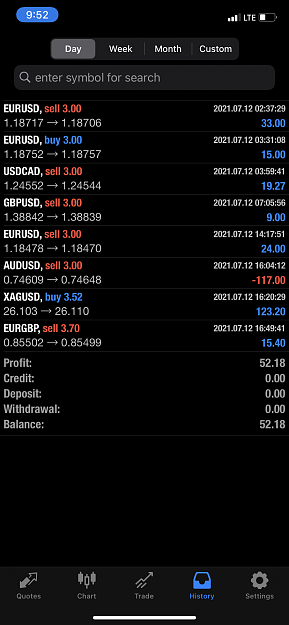
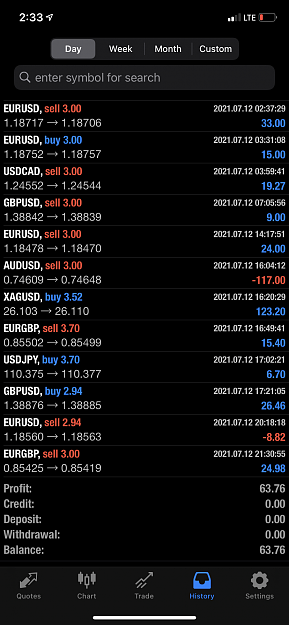
I'll post a bunch of screenshots of entries I've taken over the last few days.
If anyone is interested in the Indicators add me on TradingView.
smuggle#2138
This is an aggressive, very accurate, highly profitable scalping strategy.
Chart Setup: Heikin Ashi Candles. 1 Minute Time Frame. Make your bars on your chart something neutral , something that's not Green/Red, as our Sigma A indicator makes the bars green and red.
There's two Indicators:
Sigma A: Entry condition based on oversold and overbought conditions. This tool will change your bars colors based on oversold or overbought conditions. (Red = Overbought - Looking for short entries) (Blue = Oversold - Looking for long entries)
Sigma B Filter that's based on short term trend conditions. This tool will print a line either blue or red that calculates whether the current short term market condition is bullish or bearish:
When Sigma B line is blue we only to go long. When Sigma B line is red we only look to go short.
Trade Setup for Entries (Long)
Sigma B Line is BLUE. Wait for Price to drop below Sigma B Line. As Price is dropping below line you should see the bars change to GREEN. This means there's enough buying power for a potential entry.
Your chart bars should now be GREEN AND price is below the BLUE . Now we wait for price to cross the LINE AND the color of the bar that crossed should now be RED.
If Price has crossed the Sigma B line and all prior conditions are true then enter the trade.
Risk Management: Personal style.
Everyone has their own personal exit strategies when it comes to trading. There's no one size fits all here. Generally, the faster you can make your profit and get out the better. You could also wait for a HA indecision candle
I trade large lot sizes and exit very quickly. I've been trading FOREX and Crypto and it's been honestly insane. Remember...This is SCALPING. In and out.
I'll post a bunch of screenshots of entries I've taken over the last few days.
If anyone is interested in the Indicators add me on TradingView.
smuggle#2138
Attached Image(s) (click to enlarge)