Hey guys!
I want to begin by saying that all opinions are welcome and I hope that this might spark a great discussion on whatever the topic ends up being.
I’ve been trading for couple of years now as a hobby more or less. I’ve gone thru tons of different strategies and even though succeeding with them, I’ve always ended up looking for something else. In the past two months I came more aware of auction market theory and of course market profiles with it.
That's when I realized that all of my strategies were more or less focused in some indicatior or candle to act in a certain way, but I never questioned why those things worked or didn't work They usually simply signal that the preferred side of traders may move the market in one of two ways. But because of my stubbornness, I just can’t help but wonder, why?
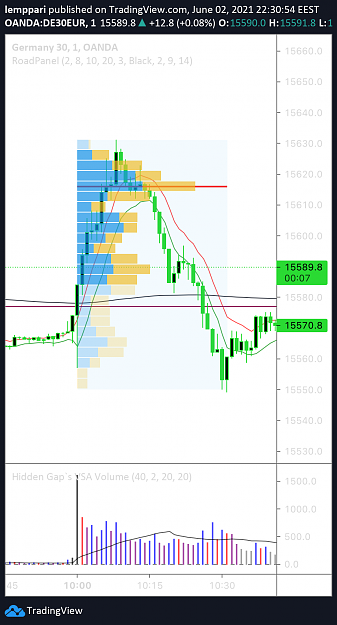
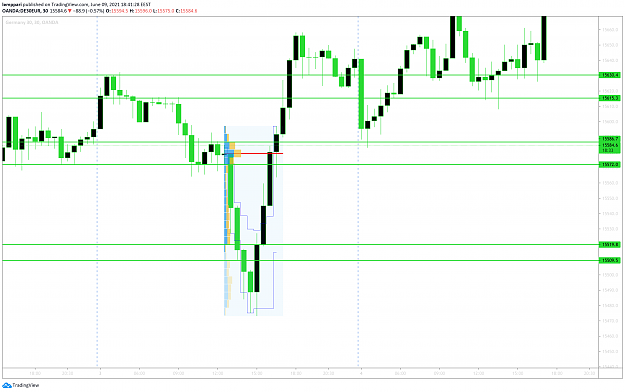
So I've begun to monitor the DAX (mostly because the daily turnover of the DAX is much lower than that of the E/U) to see if it's possible to identify traders positions. I know this could be done much more easily using dom and footprint charts, but what I want to know is where traders place their buy/sell limits, as well as their SL and TP. To see how price reacts, I've mostly used volume and pivot lines from intraday swing highs/lows. What I've discovered is that when price is arriving to a pivot line with high volume, it usually is followed by another high volume large candle before reversing.
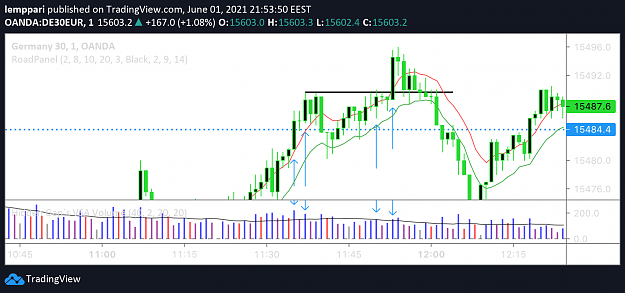
(This isn't an ideal example, but it illustrates what I mean. I also have Laura's roadmap template, which thread I highly encourage to visit the thread if you haven’t yet.)
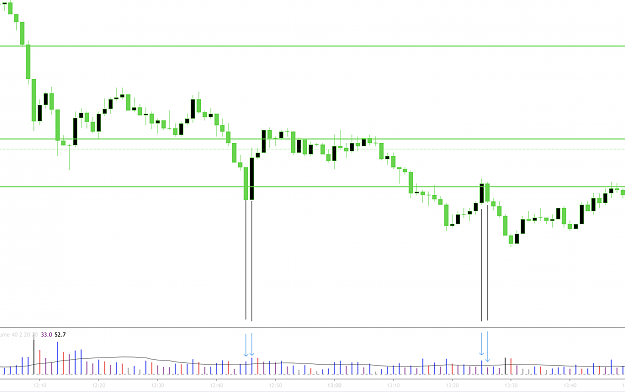
Here you can clearly see that after (as I see it) sell limits gets ’hit’ price forms high volume candle on pivot line. After that you can see another big volume candle where SL’s get’s taken out. As a result, the price is overpriced, and there is no genuine buying, resulting in decreased volume and price finding orders below the price.
I'm looking for opinions and knowledge from others who have been able to take advantage from this kind of thinking, as well as any great resources from which one could learn more.
I want to begin by saying that all opinions are welcome and I hope that this might spark a great discussion on whatever the topic ends up being.
I’ve been trading for couple of years now as a hobby more or less. I’ve gone thru tons of different strategies and even though succeeding with them, I’ve always ended up looking for something else. In the past two months I came more aware of auction market theory and of course market profiles with it.
That's when I realized that all of my strategies were more or less focused in some indicatior or candle to act in a certain way, but I never questioned why those things worked or didn't work They usually simply signal that the preferred side of traders may move the market in one of two ways. But because of my stubbornness, I just can’t help but wonder, why?
So I've begun to monitor the DAX (mostly because the daily turnover of the DAX is much lower than that of the E/U) to see if it's possible to identify traders positions. I know this could be done much more easily using dom and footprint charts, but what I want to know is where traders place their buy/sell limits, as well as their SL and TP. To see how price reacts, I've mostly used volume and pivot lines from intraday swing highs/lows. What I've discovered is that when price is arriving to a pivot line with high volume, it usually is followed by another high volume large candle before reversing.
Attached Image (click to enlarge)
(This isn't an ideal example, but it illustrates what I mean. I also have Laura's roadmap template, which thread I highly encourage to visit the thread if you haven’t yet.)
Here you can clearly see that after (as I see it) sell limits gets ’hit’ price forms high volume candle on pivot line. After that you can see another big volume candle where SL’s get’s taken out. As a result, the price is overpriced, and there is no genuine buying, resulting in decreased volume and price finding orders below the price.
I'm looking for opinions and knowledge from others who have been able to take advantage from this kind of thinking, as well as any great resources from which one could learn more.