Hi all,
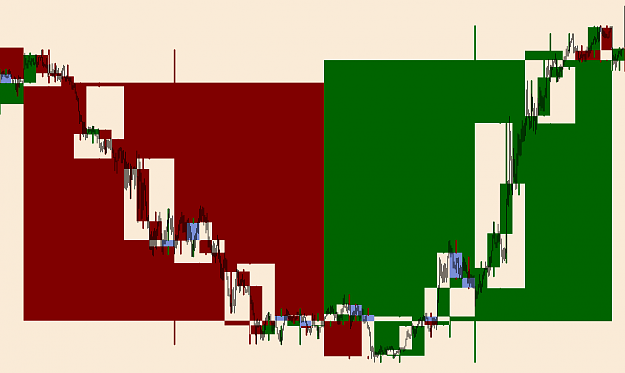
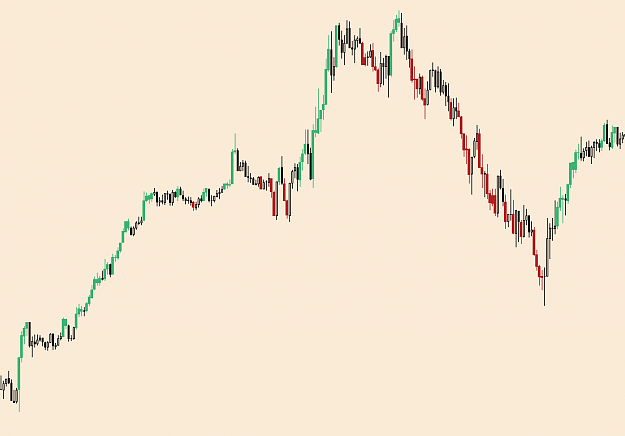
Just for illustration of what I'm after, the green and red candles in the pic below are CCI candles. I believe there are other similar indicators, e.g. RSI candles, MACD candles, etc. They highlight candles or a series of candles in the chart, with a user defined colour, according to the underlying indicator's parameters.
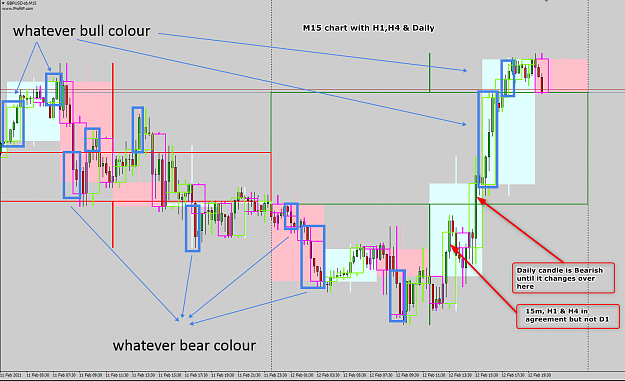
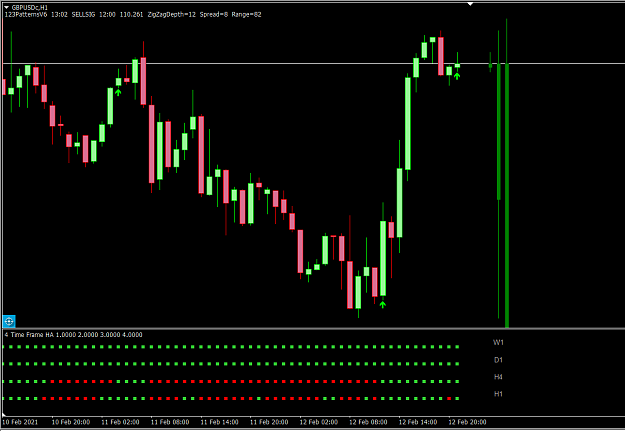
What I'm looking for is a similar but purely price-based indicator that will highlight those lower time frame candles which are simultaneously going in the same direction as (user defined) multiple higher time frames.
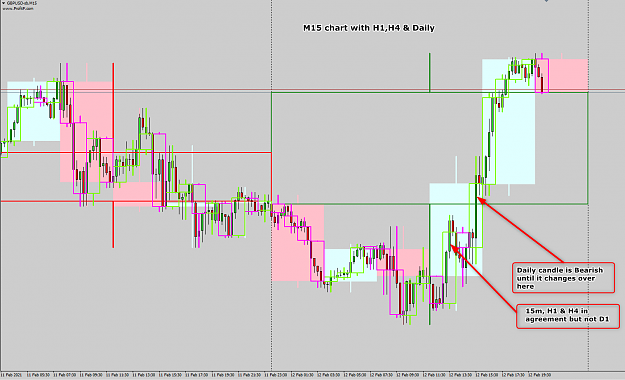
Example: if D1, H4 and M30 are all going up => on M5, highlight those candles that are in agreement with all of the above time frames at the same time.
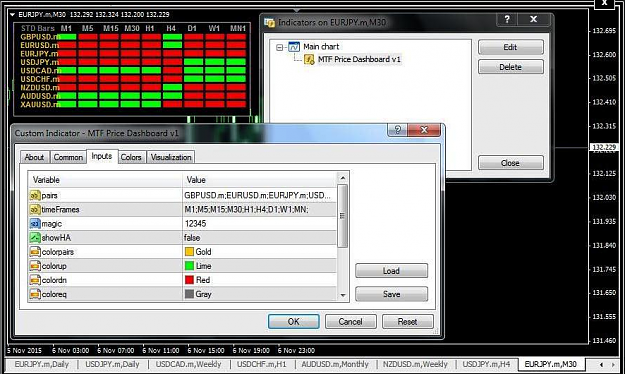
I'm using the mini charts indi at the moment in much the same way, and thought a less distractive and more 'direct' alternative would be really cool.
Many thanks in advance for posting or coding it.
Please don't post M-Candles.
Just for illustration of what I'm after, the green and red candles in the pic below are CCI candles. I believe there are other similar indicators, e.g. RSI candles, MACD candles, etc. They highlight candles or a series of candles in the chart, with a user defined colour, according to the underlying indicator's parameters.
What I'm looking for is a similar but purely price-based indicator that will highlight those lower time frame candles which are simultaneously going in the same direction as (user defined) multiple higher time frames.
Example: if D1, H4 and M30 are all going up => on M5, highlight those candles that are in agreement with all of the above time frames at the same time.
I'm using the mini charts indi at the moment in much the same way, and thought a less distractive and more 'direct' alternative would be really cool.
Many thanks in advance for posting or coding it.
Please don't post M-Candles.
Attached Image (click to enlarge)
Timing Direction Strength