A trading idea to be explored,
Ok Traders I've been collecting these charts,
I would like you all to look at them and tell me what you think,
Can this be made into a trading system,
Some information,
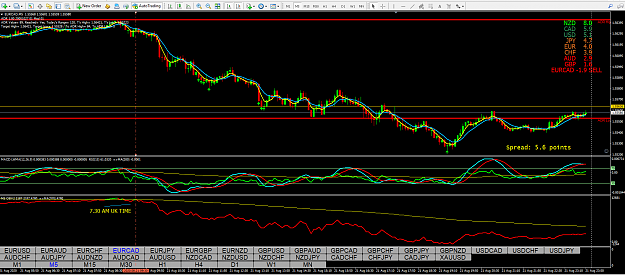
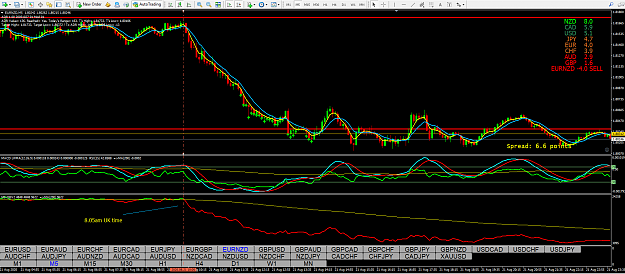
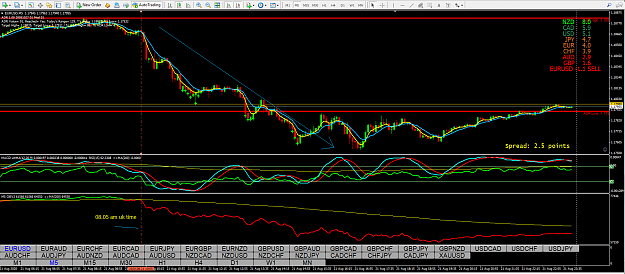
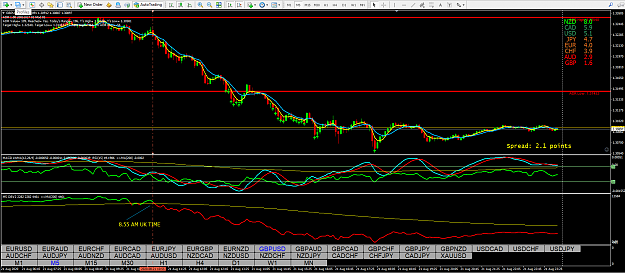
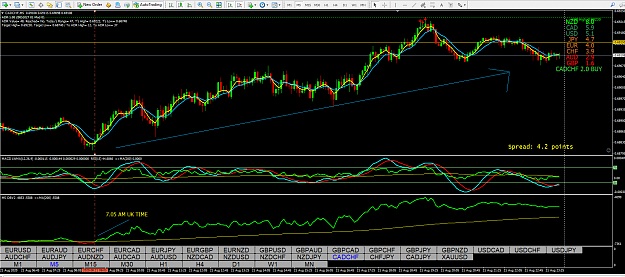
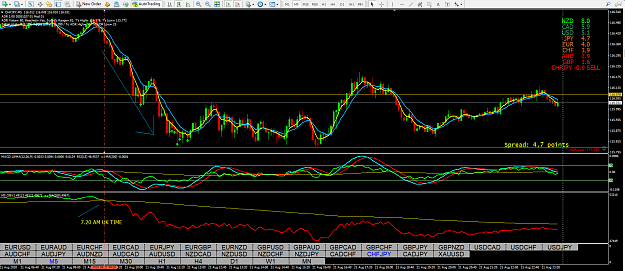
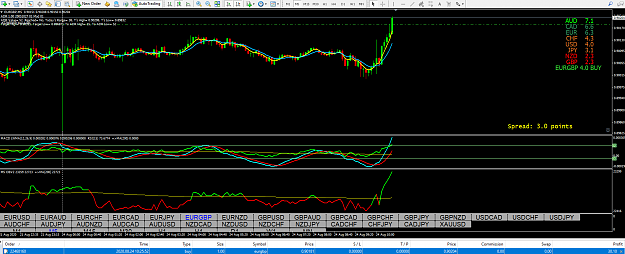
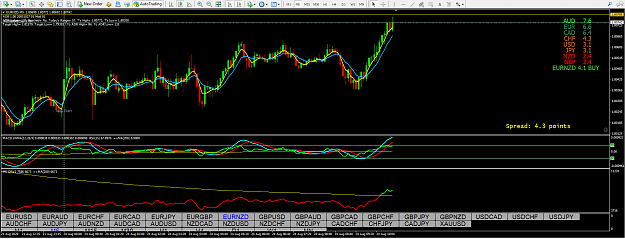
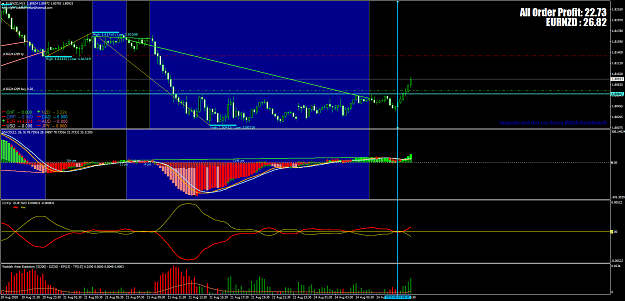
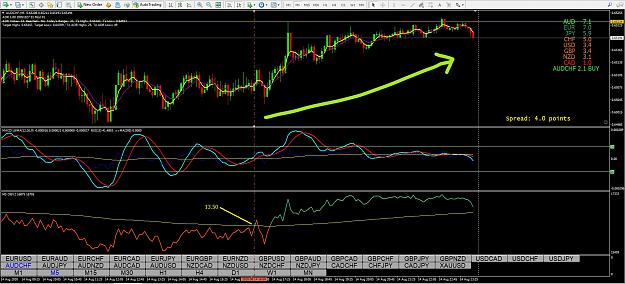
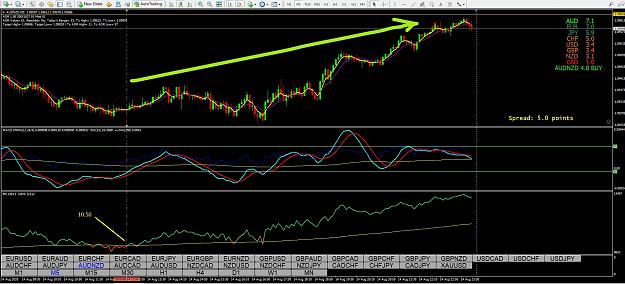
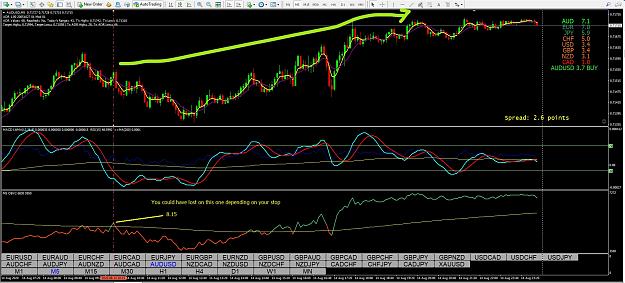
They are all five minutes charts, You will find this on every single 5-min chart,
I could put over 30 different charts ON with the same signal it happens on all chats,
The indicator generally gives a signal between 6:30am and 10:30am UK time,
So you have to check your broker time and somehow sync it into UK time,
You also get indication round about 2:30pm UK time,
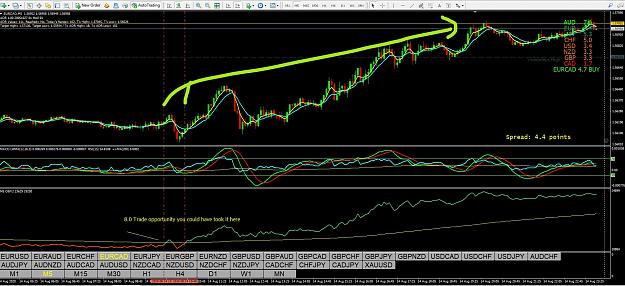
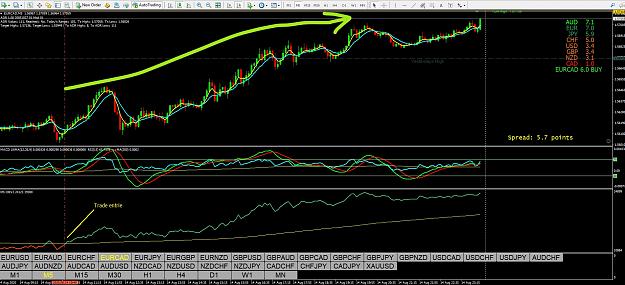
The indicated at the bottom is the OBV with a 200 exponential moving average seems to give a clear trade entry, And winning trades When it crosses, When it is above the yellow line it is in an uptrend and when it is below the yellow line it is in a downtrend,
The indicator in the middle window is the MACD, I've also put an RSI in there which is the blue line and a 200 moving average in there too,
My thinking on this is the MACD cross giving me an indication and the RSI tells me if it's oversold or overbought, I've not figured out what the 200 moving average is doing in this particular window I may delete that,
As you can see there are two moving average in the charts with the candles Which gives me an alert when the MA crosses,
But I'm not finding the entry when that crosses,
I suppose the perfect entry would be the OBV crossing the moving average at the same time the MACD crossing and the RSI in oversold or overbought area and the candles Crossing on the chart,
Why have I put this on,
Hoping some one can Shine a light on what I am missing and work out the best strategy for this clear indication on the OBV Indicator + MA window which I keep missing,
If I get enough interest I might start a thread.
See chart below,
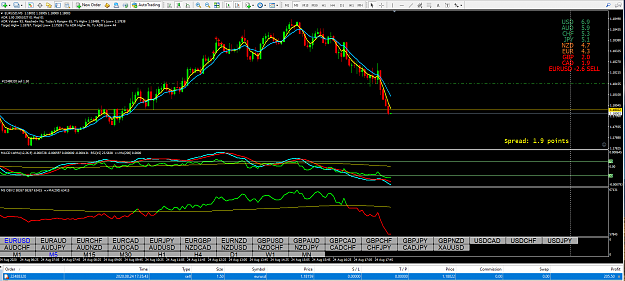
Like I said you can use this on any pair you want,
You will get this signal on them all. I've also tried this on 15 minutes charts which seemed to give indications late in the morning early afternoon.
Ok Traders I've been collecting these charts,
I would like you all to look at them and tell me what you think,
Can this be made into a trading system,
Some information,
They are all five minutes charts, You will find this on every single 5-min chart,
I could put over 30 different charts ON with the same signal it happens on all chats,
The indicator generally gives a signal between 6:30am and 10:30am UK time,
So you have to check your broker time and somehow sync it into UK time,
You also get indication round about 2:30pm UK time,
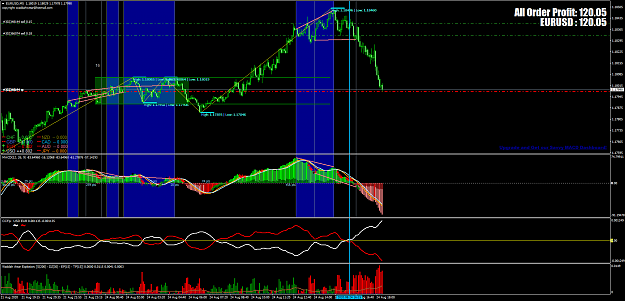
The indicated at the bottom is the OBV with a 200 exponential moving average seems to give a clear trade entry, And winning trades When it crosses, When it is above the yellow line it is in an uptrend and when it is below the yellow line it is in a downtrend,
The indicator in the middle window is the MACD, I've also put an RSI in there which is the blue line and a 200 moving average in there too,
My thinking on this is the MACD cross giving me an indication and the RSI tells me if it's oversold or overbought, I've not figured out what the 200 moving average is doing in this particular window I may delete that,
As you can see there are two moving average in the charts with the candles Which gives me an alert when the MA crosses,
But I'm not finding the entry when that crosses,
I suppose the perfect entry would be the OBV crossing the moving average at the same time the MACD crossing and the RSI in oversold or overbought area and the candles Crossing on the chart,
Why have I put this on,
Hoping some one can Shine a light on what I am missing and work out the best strategy for this clear indication on the OBV Indicator + MA window which I keep missing,
If I get enough interest I might start a thread.
See chart below,
Attached Image (click to enlarge)
Attached Image (click to enlarge)
Attached Image (click to enlarge)
Attached Image (click to enlarge)
Attached Image (click to enlarge)
Like I said you can use this on any pair you want,
You will get this signal on them all. I've also tried this on 15 minutes charts which seemed to give indications late in the morning early afternoon.