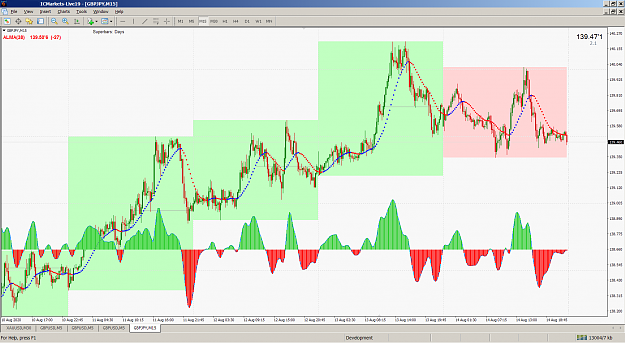
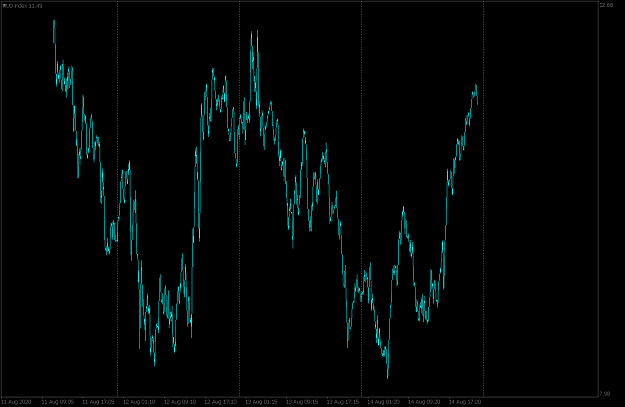
I"ve been needing to plot an indicator to overlay in the charting area but on a 2nd axis since the values won't be in the default price axis range. I recently compiled my indicator and changed the #property indicator_chart_window to #property indicator_separate_window and the indicator did exactly what I needed! Except it's probably a bug. Adding the indicator to another chart puts the indicator into a sub-window.
The data window shows the indicator value... UMA(1,1) value of .61561... clearly not anywhere near the current price axis range.
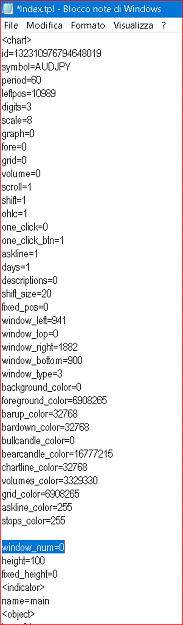
Is there a way to get my indicator into the charting area without invoking this "bug" by either adding a 2nd axis or some sort of overlay? I can't find anything related since most people seem to just use/live with the sub window.
The data window shows the indicator value... UMA(1,1) value of .61561... clearly not anywhere near the current price axis range.
Is there a way to get my indicator into the charting area without invoking this "bug" by either adding a 2nd axis or some sort of overlay? I can't find anything related since most people seem to just use/live with the sub window.
Attached Image (click to enlarge)