Hey everyone,
I'm starting this thread today so that we could collect actual data on some of the most common and widely used technical signals.
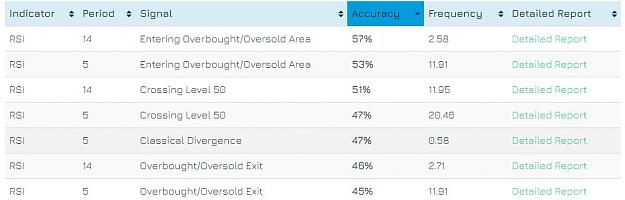
***Update*** // Check the table with the overall signal test stats
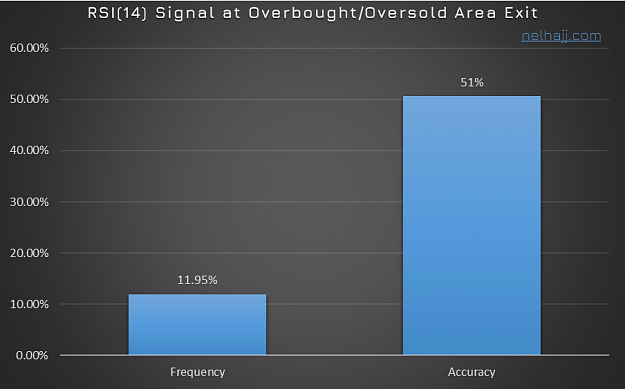
For example some of the most common technical signals are those that result from oscillators exiting overbought/oversold areas. If you load an oscillator on the chart, and scroll back through the historical data, you could see that most often than not, when RSI crosses the 70 level downwards, the price goes on to follow it downwards. But how often is that the case?
We all know that, when visually backtesting, we are often biased to disregard instances where our strategies fail. So what I want to do in this thread is to actually backtest these simple and common signals, collect their data, and then maybe we could get to see patterns from all that data, and get better insight on what works, how often does it work, and how we could exploit it in trading.
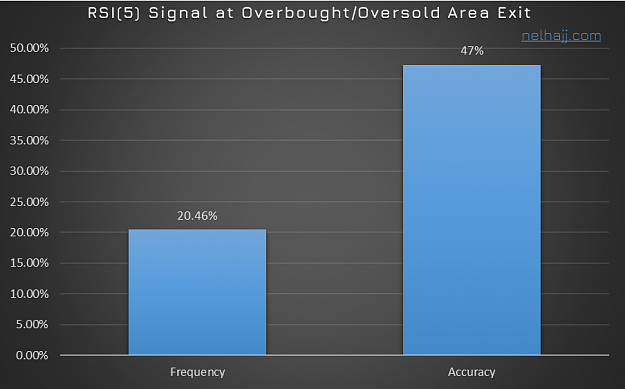
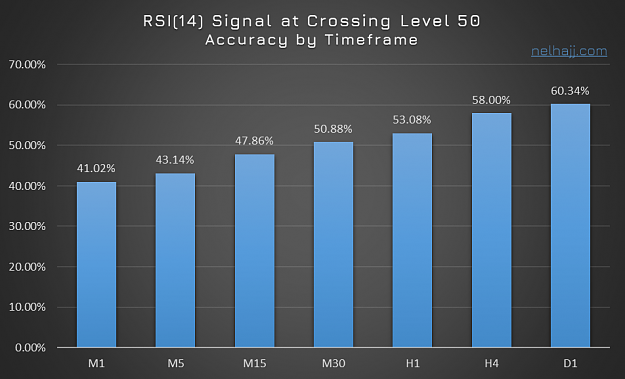
I've just started my first test on RSI. We want to see how often does price go down when RSI crosses level 50 downwards, and how much price goes up when RSI crosses level 50 upwards. I want to see how often this occurs, what's its accuracy in predicting price movement, and how big is the movement when it actually happens.
Now I have decided to create a system to test this. It's the first draft, but we could refine it further together. Here's how it works: 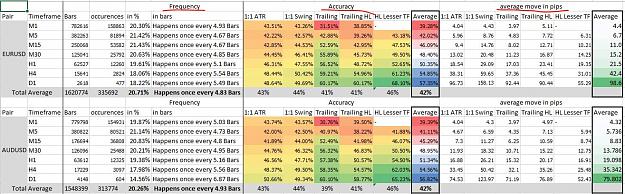
You will see the different pairs and timeframe constituting the different rows.
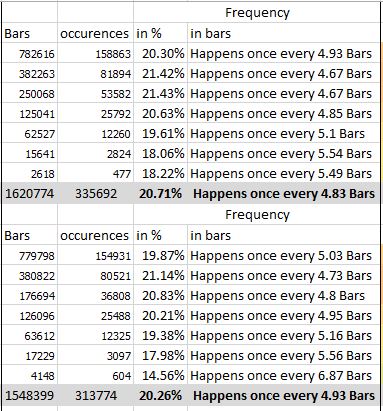
On the left you will see how many bars and trades, and the calculated frequency:
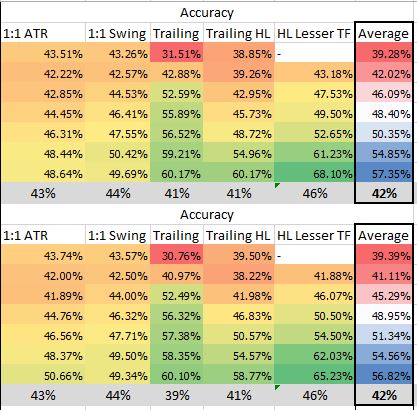
In the middle you'll see the winning ratio of each test, which reflects the accuracy of the signal. It's colored from red to green to reflect low to high accuracy, and then the average accuracy on the right of this image which is an average of all 5 tests. The bottom is the average of each type of tests:
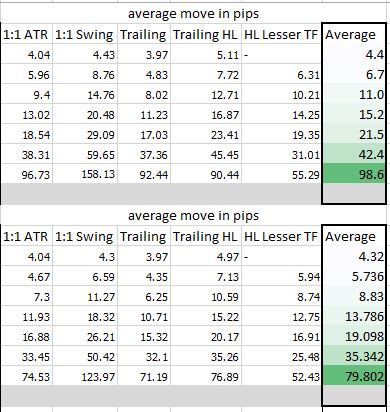
Then to the far right of the table you will see the amount of pips for each move, also with averages of both right and bottom:
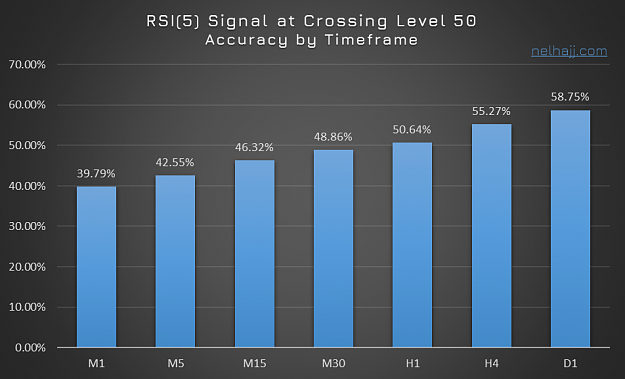
While I haven't finished testing yet, we could already get some insight on this signal on RSI 5.
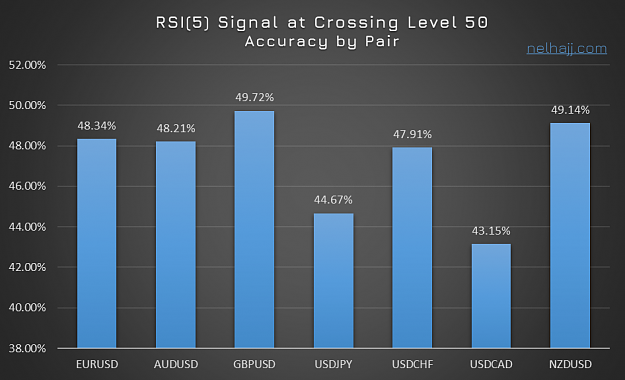
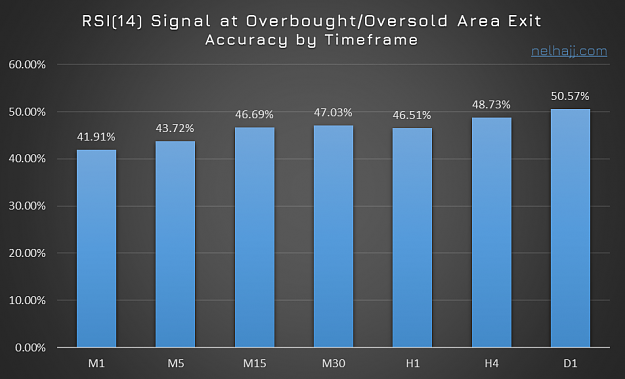
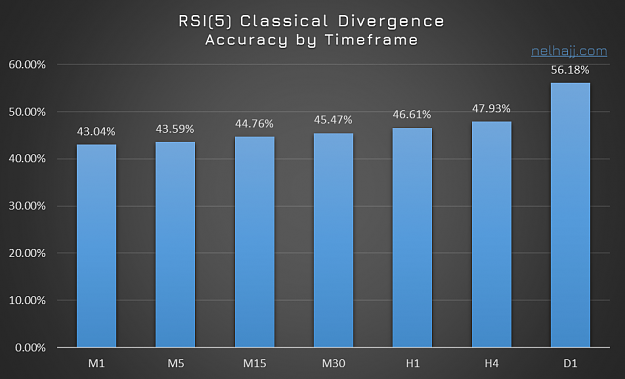
By looking at the first two columns of the winning ratio, you see that the un-managed signals are about 43 to 44 percent accurate, which is less than a coin toss.
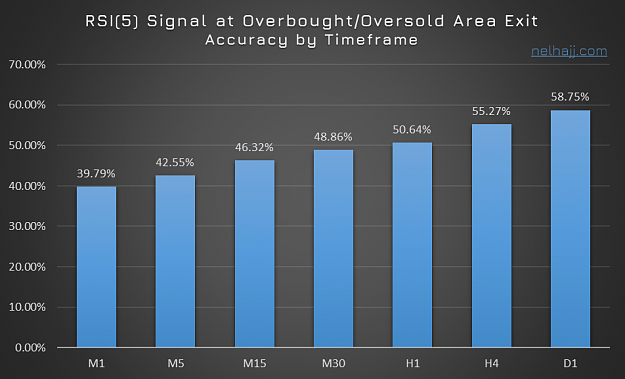
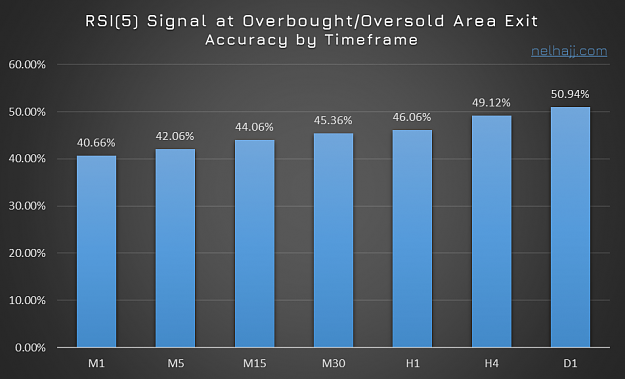
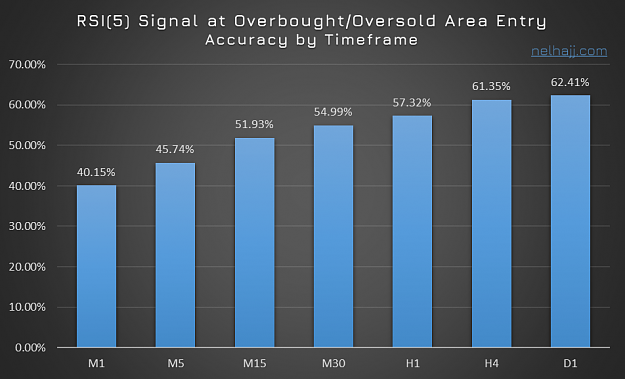
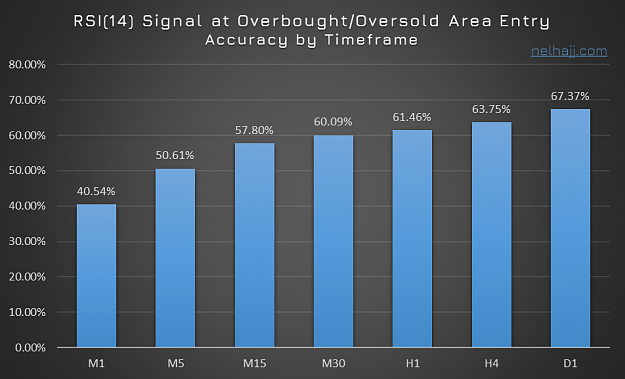
But with some management in the next three tests, we were able to raise the accuracy to go above 65 percent. But we could clearly see that the higher the timeframe the more accurate the RSI(5) overbought/oversold exit signal.
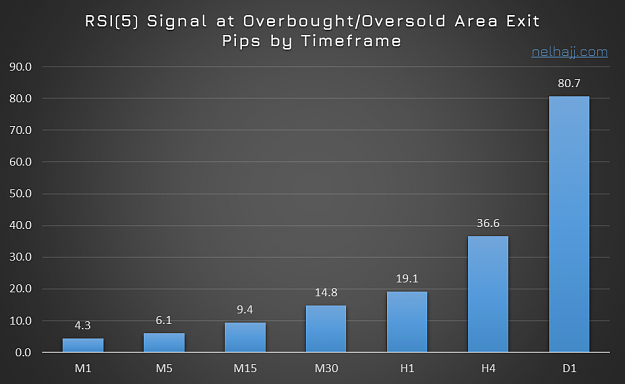
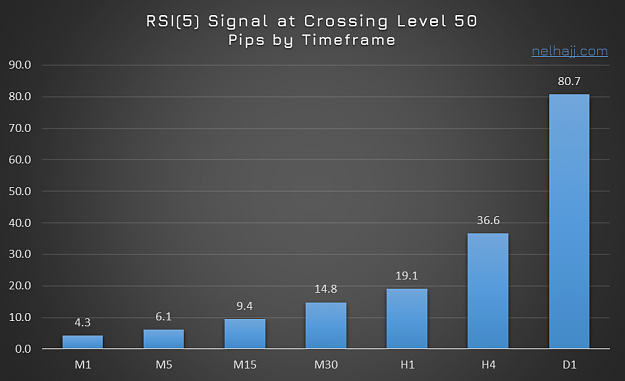
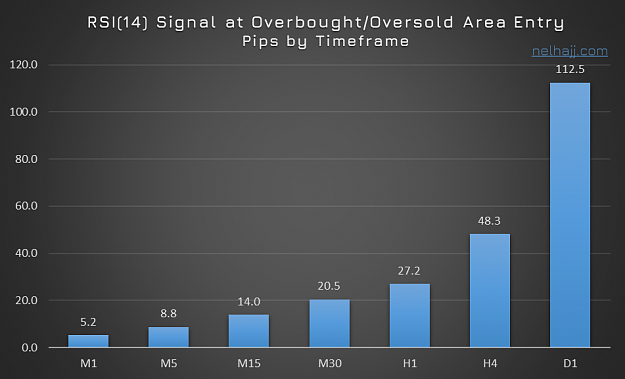
Then when we look at the average movement in pips, we could understand 2 things so far:
I'm starting this thread today so that we could collect actual data on some of the most common and widely used technical signals.
***Update*** // Check the table with the overall signal test stats
For example some of the most common technical signals are those that result from oscillators exiting overbought/oversold areas. If you load an oscillator on the chart, and scroll back through the historical data, you could see that most often than not, when RSI crosses the 70 level downwards, the price goes on to follow it downwards. But how often is that the case?
We all know that, when visually backtesting, we are often biased to disregard instances where our strategies fail. So what I want to do in this thread is to actually backtest these simple and common signals, collect their data, and then maybe we could get to see patterns from all that data, and get better insight on what works, how often does it work, and how we could exploit it in trading.
I've just started my first test on RSI. We want to see how often does price go down when RSI crosses level 50 downwards, and how much price goes up when RSI crosses level 50 upwards. I want to see how often this occurs, what's its accuracy in predicting price movement, and how big is the movement when it actually happens.
Now I have decided to create a system to test this. It's the first draft, but we could refine it further together. Here's how it works:
- I will test 3 different RSI periods i.e 5, 14, and 21.
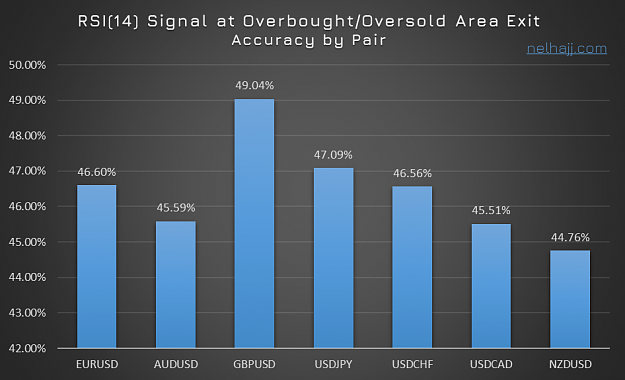
- The tests will be done on the 7 major pairs, on 7 timeframes.
- I created an EA that opens trades whenever the signal occurs.
- 5 tests will be done for each RSI period on each one of the 7 timeframes of the 7 pairs:
- Fixed SL and TP at an ATR distance from the open price (1:1) - gives an unmanaged result of how often price goes our way
- SL placed at the previous swing hi/lo - TP at a 1:1 distance - same as above with a varied distance of SL and TP
- Normal Trailing at ATR - Initial SL placed at the previous swing hi/lo - makes sure we detect small movements in our direction
- Trailing behind previous candle hi/lo - Initial SL placed at the previous swing hi/lo - catches longer movements in price
- Trailing behind previous candle hi/lo on nearest lesser timeframe - Initial SL placed at the previous swing hi/lo - somewhere between the two tests above
I will then focus on 3 results of the tests:
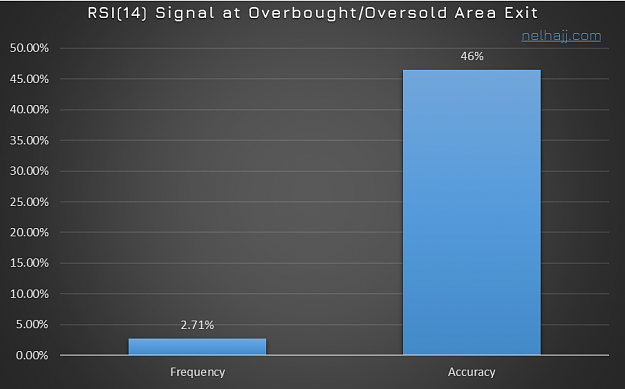
- number of trades/number of bars - This gives us the frequency of the signal
- winning ratio - This gives us the accuracy of the signal
- average profit pips - This reflects the average movement in pips that the signal predicts, when it gets it right
So I've started running these tests on EURUSD and AUDUSD, and I will move on to the next pairs in the next few days, but here's a quick view of the results I've gotten so far:
Attached Image (click to enlarge)
You will see the different pairs and timeframe constituting the different rows.
On the left you will see how many bars and trades, and the calculated frequency:
Attached Image
In the middle you'll see the winning ratio of each test, which reflects the accuracy of the signal. It's colored from red to green to reflect low to high accuracy, and then the average accuracy on the right of this image which is an average of all 5 tests. The bottom is the average of each type of tests:
Attached Image
Then to the far right of the table you will see the amount of pips for each move, also with averages of both right and bottom:
Attached Image
While I haven't finished testing yet, we could already get some insight on this signal on RSI 5.
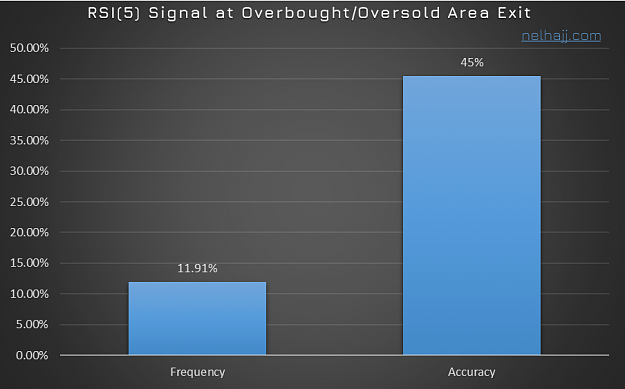
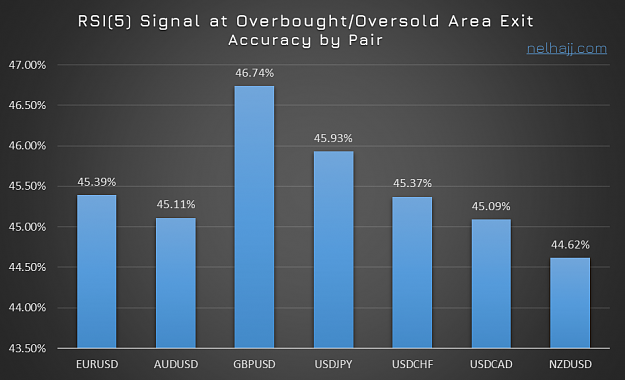
By looking at the first two columns of the winning ratio, you see that the un-managed signals are about 43 to 44 percent accurate, which is less than a coin toss.
But with some management in the next three tests, we were able to raise the accuracy to go above 65 percent. But we could clearly see that the higher the timeframe the more accurate the RSI(5) overbought/oversold exit signal.
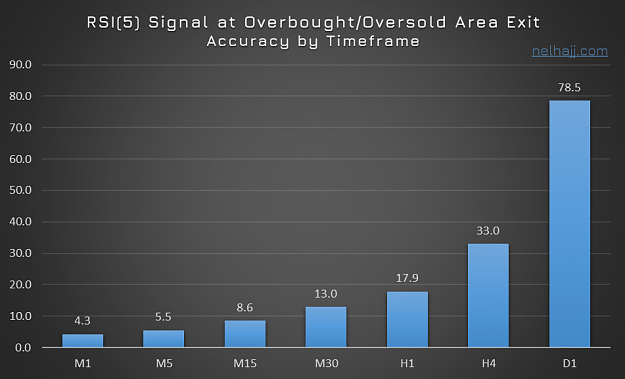
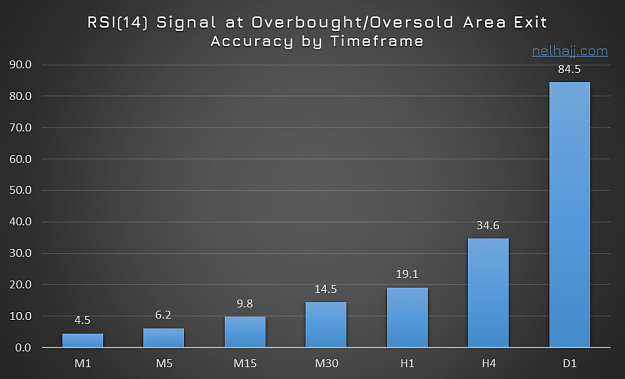
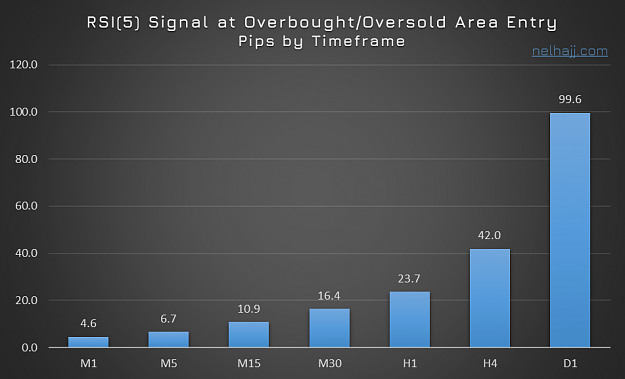
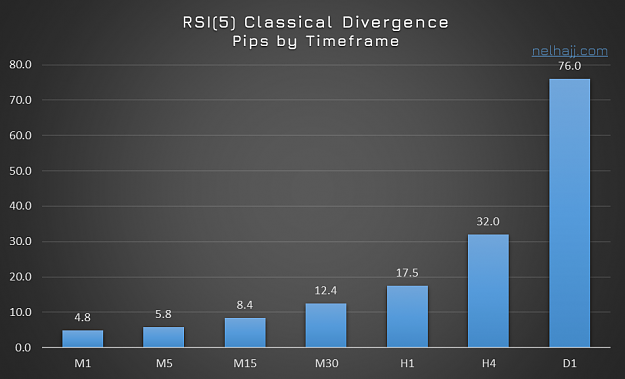
Then when we look at the average movement in pips, we could understand 2 things so far:
- This signal predicts bigger moevements in EURUSD than in AUDUSD.
- Using this signal to scalp on M1 and M5 gets you no more than 5-6 pips, which could easily disappear with spreads, stop levels and commissions.
As I said, I will continue testing this signal for the next few days, then I will move on to test RSI exiting the overbought/oversold 70/30 areas, then RSI entering the overbought/oversold areas.
Let me know what you think of these tests, if perhaps you have some more data you would think is good to collect from the tests, or maybe if you think the testing system is flawed and should be tweaked.
Would love to hear your thoughts while I continue the tests