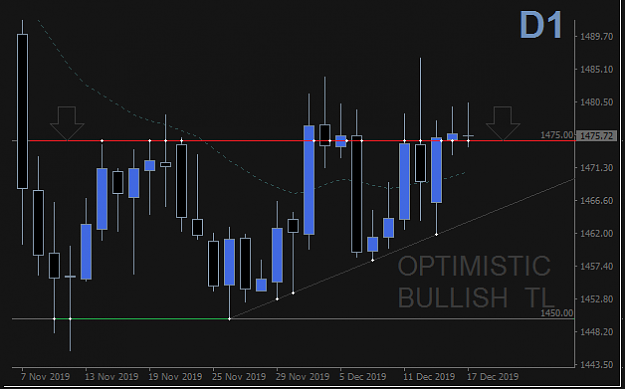
{quote} Technically still there. I'll see D1 close way above 1475, I'll buy ...not until then. Don't die. Keep your pants on! {image}
Ignored
Agreed the daily close becomes all too important
Pending Short at that 1480 Upside Level.....the m5 HnS target achieved so to speak as such will look to ride the H1 setup thats still on the cards....price back above the m15 200 handle in line with the H1 buy zone may try push this thing back up again......so far 3 buy setups as per H1 buy zone today.....
{quote} Agreed the daily close becomes all too important Pending Short at that 1480 Upside Level.....the m5 HnS target achieved so to speak as such will look to ride the H1 setup thats still on the cards....price back above the m15 200 handle in line with the H1 buy zone may try push this thing back up again......so far 3 buy setups as per H1 buy zone today.....
Ignored
Yeap, daily close becomes important because 1475 seem pain in the arse resistance! Pretty much steady so far... more than 20 days!
Bull pressure, optimistic bull trend line ...might follow a bull break ...we'll see
Joined Dec 2018
|
Status: Big Operator
|4,525 Posts
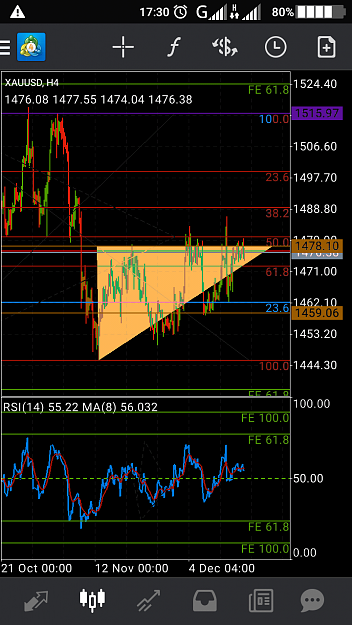
As a caution!...from November 12th 2019 till date on the H4 time frame, an ascending triangle chart pattern has been formed...Meaning a breakout is about to occur!
But, wait a minute, 1478.10 is a support in July 2011 now turned resistance in December 2019.
A lot of attempts has been made by the bulls to break through this level, but has always resulted in false breakouts.
As a caution!...from November 12th 2019 till date on the H4 time frame, an ascending triangle chart pattern has been formed...Meaning a breakout is about to occur! But, wait a minute, 1478.10 is a support in July 2011 now turned resistance in December 2019. A lot of attempts has been made by the bulls to break through this level, but has always resulted in false breakouts. Wow! Trading is war! We Stay Alive this time.
Ignored
Visual aid please bud.....
managed to get in long near that desired handle
As a caution!...from November 12th 2019 till date on the H4 time frame, an ascending triangle chart pattern has been formed...Meaning a breakout is about to occur! But, wait a minute, 1478.10 is a support in July 2011 now turned resistance in December 2019. A lot of attempts has been made by the bulls to break through this level, but has always resulted in false breakouts. Wow! Trading is war! We Stay Alive this time.
Joined Feb 2016
|
Status: Full Time Trader.
|5,429 Posts
18/12/19
Daily close more or less near the previous daily close, the 1480 and 1473 range has remained intact for a couple of sessions now, as such will look to sell the high and buy the low, more so if they happen to coincide with the intra day levels..we need to remain patient till a clear break out in either direction ensues...
H1 is flat with a bearish bias while the D1 sell zone still intact but has also begun flattening out...will look to see what London open brings about and follow leading up to the NY open....
H4 Buy Zone is the only zone that is clearly intact(1474.03 - 1475.79)
Intra day levels
Upside
1487.22
1485.93
1483.22
1479.67
Downside
1475.83
1473.41
1471.65
1470.70
1467.15
18/12/19 Daily close more or less near the previous daily close, the 1480 and 1473 range has remained intact for a couple of sessions now, as such will look to sell the high and buy the low, more so if they happen to coincide with the intra day levels..we need to remain patient till a clear break out in either direction ensues... H1 is flat with a bearish bias while the D1 sell zone still intact but has also begun flattening out...will look to see what London open brings about and follow leading up to the NY open.... H4 Buy Zone is the only zone...
Ignored
SOme serious rejection yet again from that first intra day level, wash rinse and repeat till it fails....
Buying the H4 buy Zone selling the interim range ceiling....
Joined Dec 2018
|
Status: Big Operator
|4,525 Posts
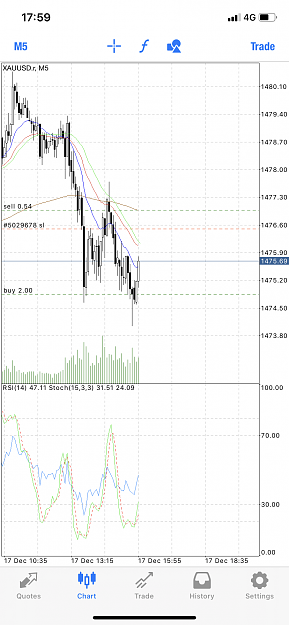
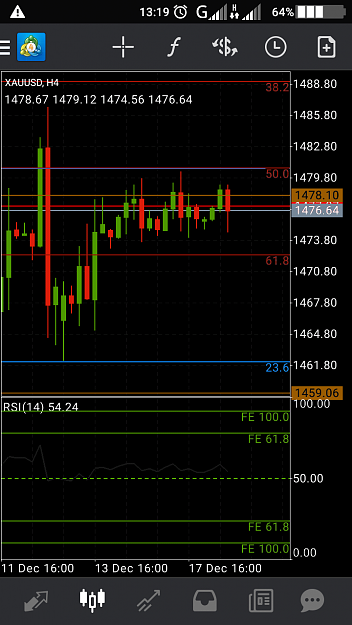
The most delicate continuation pattern... H4 has completed its FALLING THREE candlestick formation and then the right side of its castle pattern at this same level 1478.10
Selling resumes. We've waited for so long.
The most delicate continuation pattern... H4 has completed its FALLING THREE candlestick formation and then the right side of its castle pattern at this same level 1478.10 Selling resumes. We've waited for so long. Stay Alive! {image}
Ignored
Hi, what is this castle pattern? I could not find it in internet Thank you.
{quote} Hi, what is this castle pattern? I could not find it in internet Thank you.
Ignored
It is not there!
I coined it out myself from a lot of screen time...
It has two tops(heads) and two shoulders on each side to the tops...
It is a head and shoulder pattern variation.
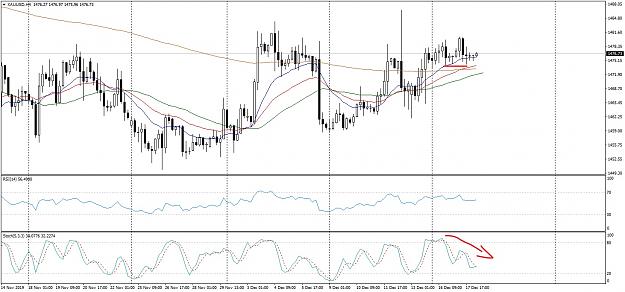
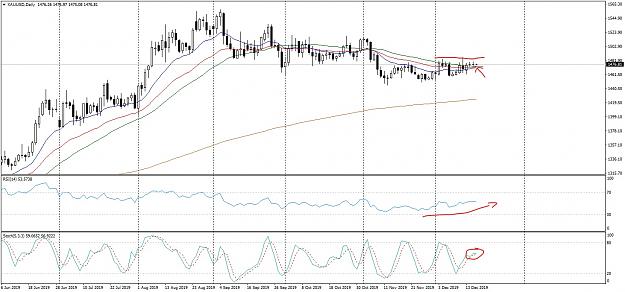
Price has used the lower band of the daily buy zone as support, both the fast and slow emas on the daily are upward sloping with the RSI on the daily also pointing up.... not suggesting that bears are done and dusted for now it’s clear where to short from....that 1480/79 handle....as fontu mentioned, the daily close becomes important now....green pips
That said.....
as per H4 buy zone...
long 1475
Sl 1469
TP Open
{quote} Price has used the lower band of the daily buy zone as support, both the fast and slow emas on the daily are upward sloping with the RSI on the daily also pointing up.... not suggesting that bears are done and dusted for now it’s clear where to short from....that 1480/79 handle....as fontu mentioned, the daily close becomes important now....green pips That said..... as per H4 buy zone... long 1475 Sl 1469 TP Open