Let's get started with what I think is probably the most fundamental element of being able to read a chart.
Being able to properly identify price swings.
Definitions:
In an uptrend price makes HHs and LHs. However a low is not confirmed until there is a new high.
In a downtrend price makes LHs and LLS. However a high is not confirmed until there is a new low.
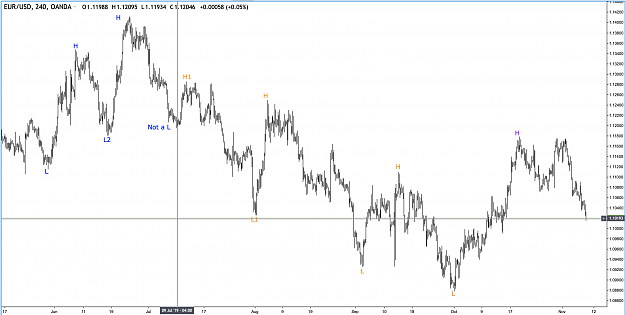
This is a EURUSD 240 min chart. I've marked it up a bit.
Notice the blue uptrend followed by the orange downtrend then there looks to be a purple uptrend.
When blue L2 is taken out by orange L1 then orange H1 becomes a confirmed high. "Not a low" was never confirmed since a new high did not form after it occurred.
Also note that H1 becomes a lower high in the orange down trend.
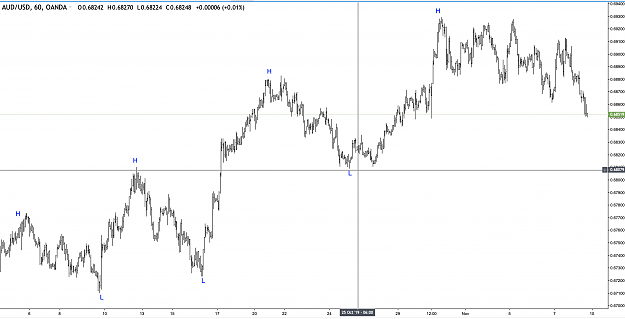
Now let's look at AUDUSD H1. First chart is just an overall picture of the larger swings. It's uptrending with confirmed swing lows as shown.
Attached Image (click to enlarge)
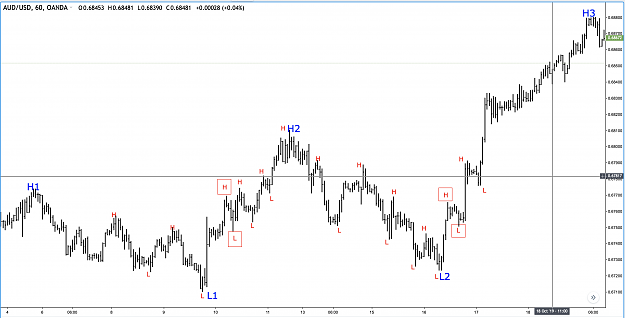
L1 to H2 is an impulse leg. L2 to H3 is also an impulse leg. H1 to L1 is a reactive leg or retracement leg and H2 to L2 is a reactive leg.
Now look at the smaller red swings. Can you see when the reactive leg down trends end and the impulse leg begins?
The boxed Hs and Ls show this. Is this illuminating? I think it is!
Attached Image (click to enlarge)
Understanding basic swings and being able to identify them clearly is absolutely the beginning of being able to trade.
It doesn't always happen that a new high will always happen in an uptrend or that new low will always happen in a downtrend but don't you think it's a place to start?
It can be confusing when you first open up a chart.
* How small or big should the candles or bars be?
* What time frame should I use?
* What information to the left of current price is relevant?
* Is analysis of higher and lower time frames necessary?
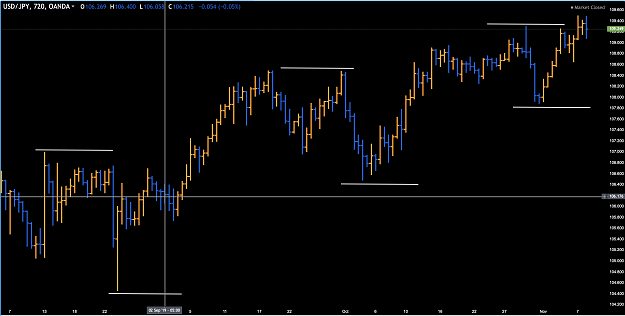
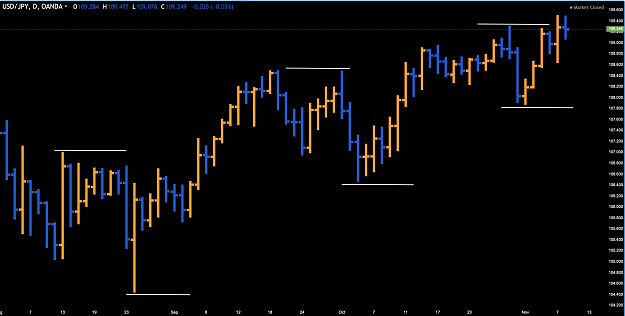
Below is USDJPY on different time frames. I've essentially used the same swings but have refrained from including any data prior to the first swing. What do you think?
Here's the truth about each of the charts below.
^ Each one can stand alone by itself and can be traded as shown.
^There is no reason on any of theses charts to look further to the left to decide what you should do on the right.
^You do not need to know what is happening on the H1 chart to trade the H4 chart or do you need to know what is going on with the Day chart to trade the H1 or H4 chart.
No time frame is better than another. Choosing which time frame you want to trade is mostly a life style choice. Some choose one time frame and look at several different markets on the same time frame to trade. Others look at different time frames to find the best setups.
BUT looking for price action on a lower time frame to enter on a higher time frame or vice versa is cumbersome and will lead to analysis paralysis.
It's plain and simple: Trade the time frame you find the setup on and forget what is happening on other time frames.
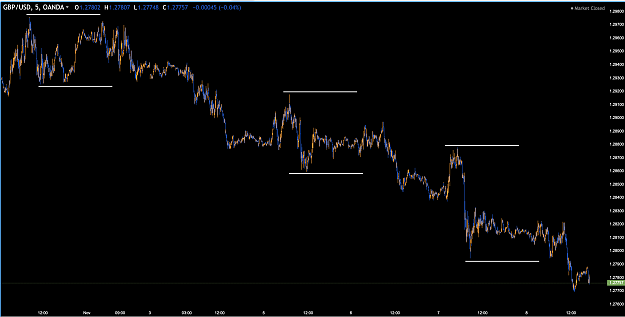
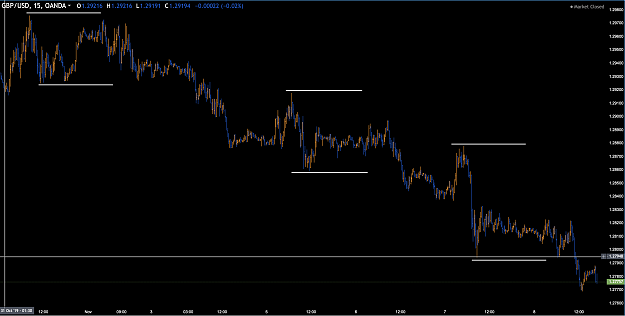
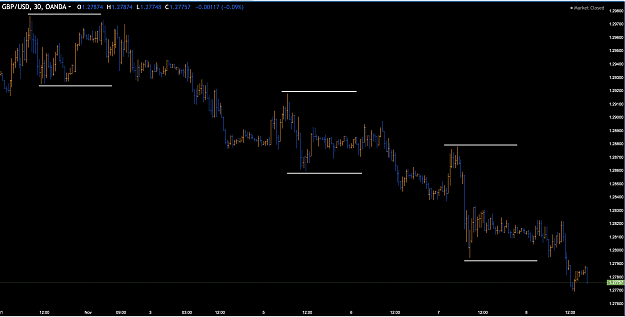
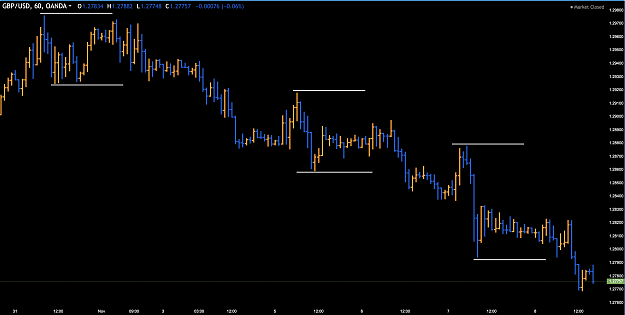
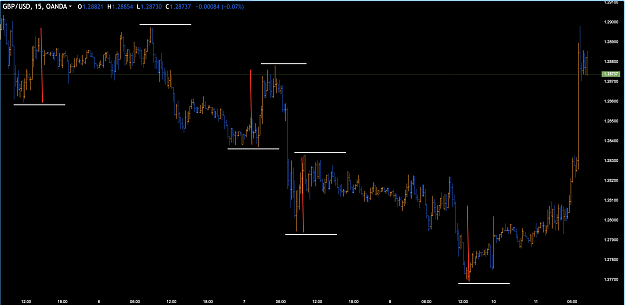
This is GBPUSD showing charts on 5, 15, 30 and 60 minute time frames.
Each one can stand on its own.
Each one can be traded by itself without looking at any of the others.
In review we've basically discussed the most important fundamental of understanding price action: SWINGS
We've gone over how one can identify swings using the definitions:
A new high confirms a swing low - uptrend beginning. Series of new highs is an uptrend.
A new low confirms a swing high - downtrend beginning. Series of new lows is a downtrend.
We can further clarify our swings by their size. Measuring the size of the swings is a valuable tool.
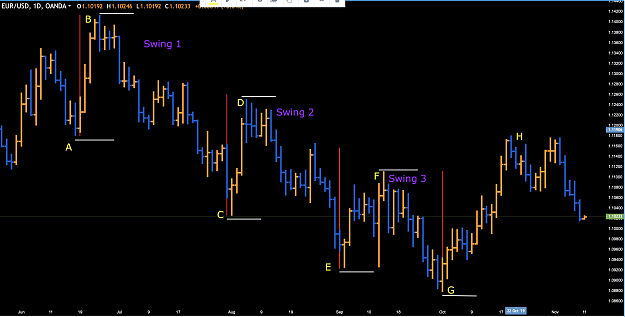
In the chart below it is clear that overall price is trending down. Within this downtrend are 3 swings. A-B, C-D and E-F. These are the retracement or reactive legs before price impulsed down again. So after A-B price impulsed to C. After C-D price impulsed to E. And after E-F price impulsed to G.
By measuring the reactive legs we establish reference points. These can be used as gauges or limits. Once price reaches the limit of a reactive swing based on a previous reactive swing we can start to think about whether or not price is going to continue the same and turn for the next impulse or if it is not.
Notice G-H. This swing clearly violated previous reactive swing sizes. Does this mean price is going to start swinging to the upside? G-H satisfies the rule: a new high confirms a low and thus is the potential beginning of new uptrend.
This is beautiful to me. It is an absolutely objective framework for following price and price swings and is the beginning of not only understanding price action but of formulating a potential trading strategy. If the wheels aren't turning then please go back and review or please ask questions.
This was a pm I received. Permission was given to post it here.
"Hi Abe16,
I like your threads and wonder why you make it vey simple but when we trade like that chart we can not win. May I ask you ,with the trend like high low ,low high ,what is the name of indicator you use to draw chart like that ( I mean short horizon for each of low high ,I am sorry to ask dump question but I am new in this market . "
First I encourage everyone, especially new traders, to ask questions and post them here rather than via pm.
Next I want to be clear that so far no trading method, strategy or system has been proposed so far. It's interesting that by articulating the fundamentals that I have so far that there is a feeling that a trading method has been or is being created. The basic principles I have presented thus far should really be fundamental to ANY trading strategy and in fact can be the underpinning of a potential trading strategy.
Finally I want to be clear that no indicators of any kind are being used. I use lines, rectangles, arrows, text, etc. but no indicators at all.
Please post your questions and your charts. This thread is really meant to be interactive and not just a "step-by-step" guide.
Please see my drawing with line .Base on chart will be long for USDJPY with HL .{image}
Ignored
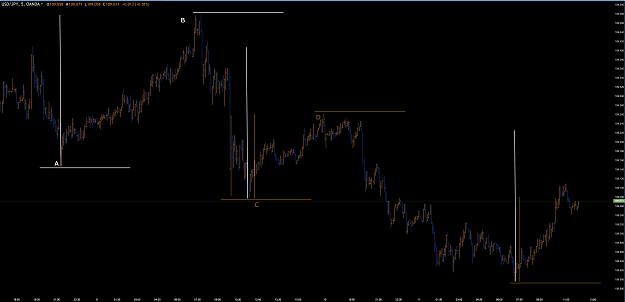
In keeping with what we've learned in this thread so far I've marked out the largest swings. I've also measured them as shown.
Price has been trending down overall.
A-B is the largest reactive leg. The white vertical line measures it. B-C is the first impulse leg. C-D is the next reactive leg. The brown vertical line measures it. D to ___ is the next impulse leg.
I've brought down the white and brown vertical measuring lines to the bottom right.
As can be seen price has swung up and has exceeded the brown sized reactive swing.
For now I'm not going to comment on any trades you may have taken or may want to take. Trading comes after the fundamentals are clearly understood.
So far in this thread we've reviewed swings, how to measure swings and how to think about data and time frames.
Hi Abe,
With your chart I can see with LTF we should go with large swing or we can go HTF with large swing too.With vertical line we can see trend . I have not recognize large swing yet .Let me post the other chart later to find out swing .Thanks
Munchie
Hi Abe, With your chart I can see with LTF we should go with large swing or we can go HTF with large swing too.With vertical line we can see trend . I have not recognize large swing yet .Let me post the other chart later to find out swing .Thanks Munchie
Ignored
USDJPY30min looks good to me.
Instead of vertical lines to measure I'm going to start using diagonal lines to measure. So in this case the A-B swing is duplicated and pasted on the C-D swing. The pasted line is just a measurement so don't expect it to perfectly mimic the C-D swing.
Hi Abe, Please see the attachment. I drawn UJ and base on my drawn UJ up trend because high low last one on right. Please be advise .Thanks{image}
Ignored
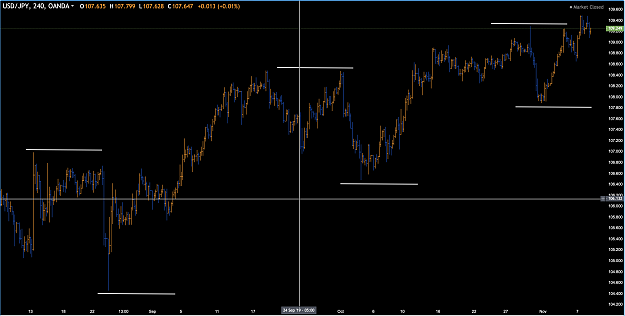
Hey Munchie,
I'm having a difficult time understanding your blue rectangle markings. They don't seem to consistently identify sequential highs and low.
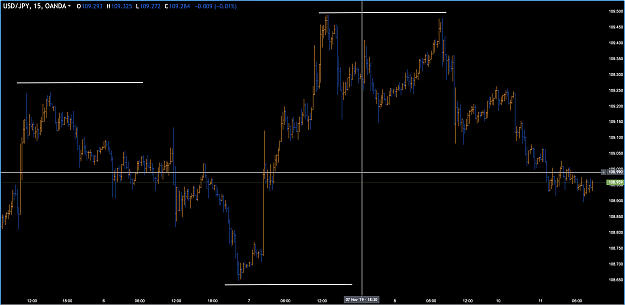
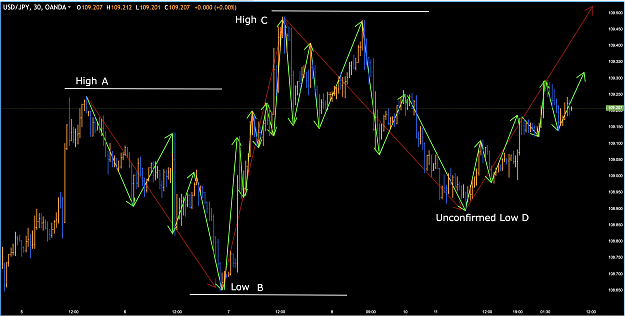
The chart below is USDJPY 30 min. It is busy but I want to be clear about swings.
The red arrows identify the major or large swings.
The green arrows identify the smaller or minor swings.
I think the swings you are referring to on the right are minor swings.