Good morning,
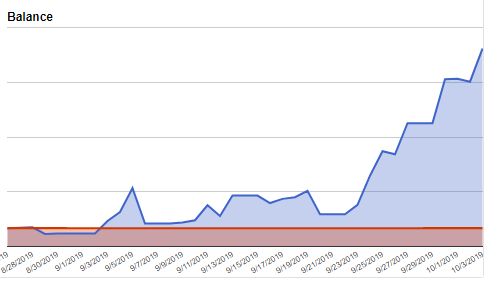
I have been following along here for a month or so and have been getting great results. Thanks MzansiObi!
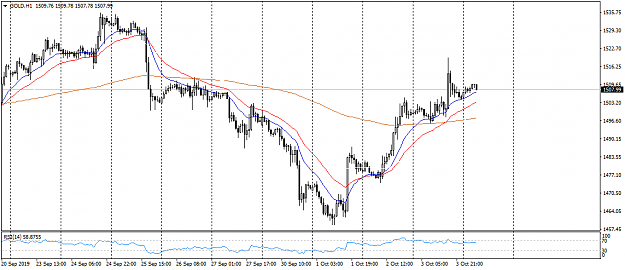
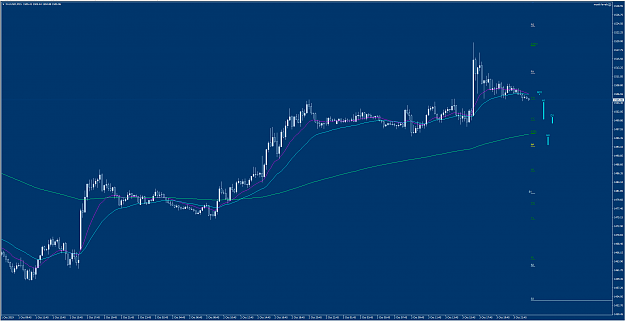
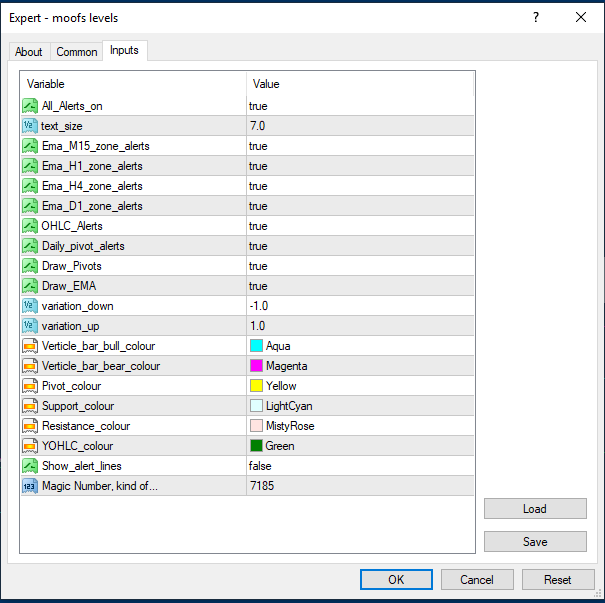
I am working on an EA that plots all the important levels and alerts when it approaches levels.
I Love an uncluttered chart and this is my attempt at achieving that.
Verticle lines are the EMA zones that change colour if they are buy or sell.
Its not quite finished yet, I need to add monthly and weekly pivots.
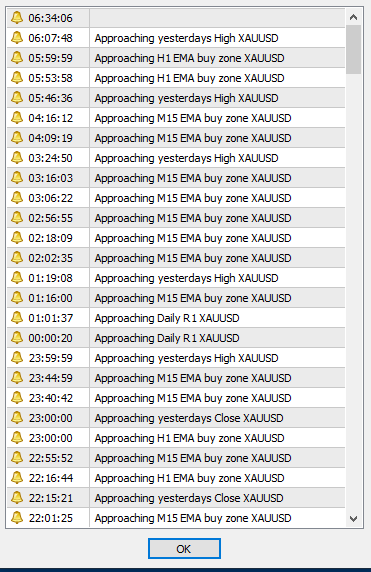
Let me know any other important levels you would like added, so far I have:
Alerts for horizontal or trend lines drawn on the chart.
Daily pivots and SR.
ADR High and ADR Low
Yesterdays OHLC
Last weeks H/L
Last Months H/L.
Trade Safe!
I have been following along here for a month or so and have been getting great results. Thanks MzansiObi!
Attached Image
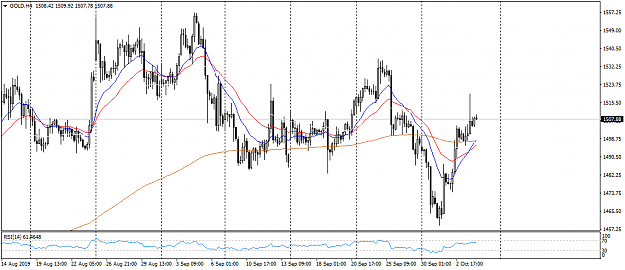
I am working on an EA that plots all the important levels and alerts when it approaches levels.
I Love an uncluttered chart and this is my attempt at achieving that.
Verticle lines are the EMA zones that change colour if they are buy or sell.
Attached Image (click to enlarge)
Its not quite finished yet, I need to add monthly and weekly pivots.
Let me know any other important levels you would like added, so far I have:
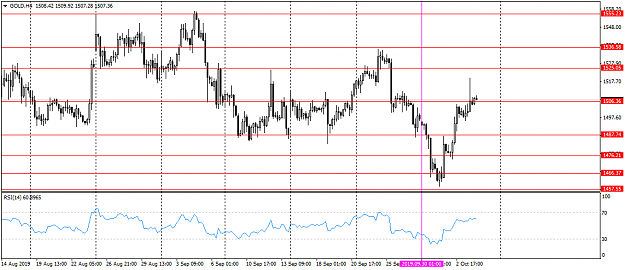
Alerts for horizontal or trend lines drawn on the chart.
Daily pivots and SR.
ADR High and ADR Low
Yesterdays OHLC
Last weeks H/L
Last Months H/L.
Attached Image
Attached Image
Trade Safe!
2