Attached Image (click to enlarge)
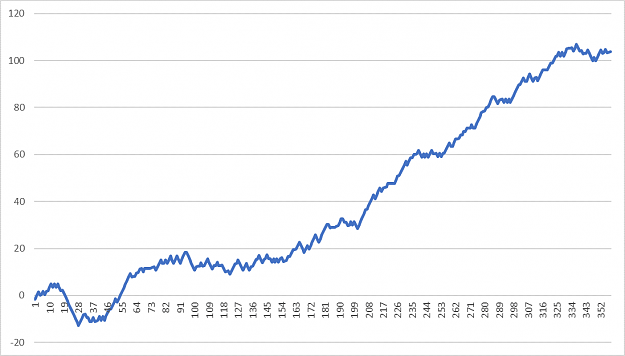
The graph above is test results from this trading plan – tested over 5.5 month period and 32 currency pairs at 1.5% risk per trade. In reality, this result is not feasible due to the number of pairs involved and the number of trades in one day (max 8 trades in one day)/the margin that would be required at 1:30/20 leverage, let alone the exposure on your account any one point. However, I wanted to continue testing until the results surpassed 100% at 1.5% risk as proof of concept. Breaking this down further, profitable trades account for 45% of trades, losses 28% and breakeven 26% - however, my breakeven trades are small profits at 0.25% (explained later).
The Plan
Shortlisting
Attached Image (click to enlarge)
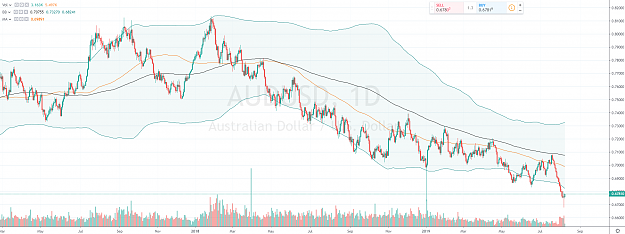
I do not trade markets that are ‘over-extended’ as I feel that prices are more erratic. To shortlist markets, my plan starts with the daily chart and Bollinger Bands (BB) (Length 200, StdDev 2).
I am looking to avoid entering continuation trades where a reversal is likely to occur. If the current price is outside of the BB (upper or lower band), as it is at the time of writing this on AUDUSD, I will not trade that market. I will also not enter a trade where either the stop loss or profit target surpasses the BB or the 200-day SMA.
Trade Setups
Attached Image (click to enlarge)
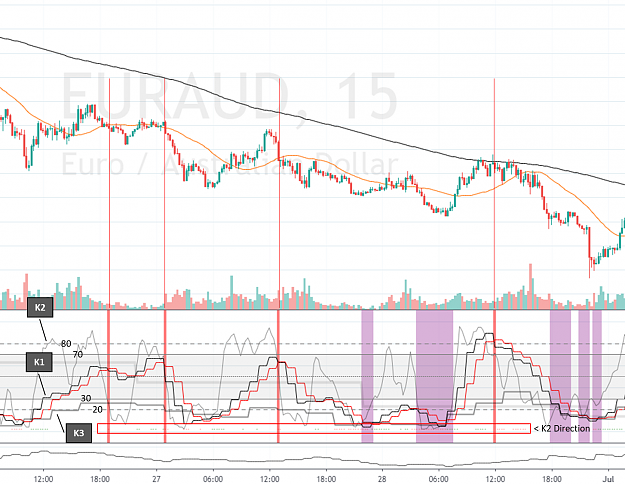
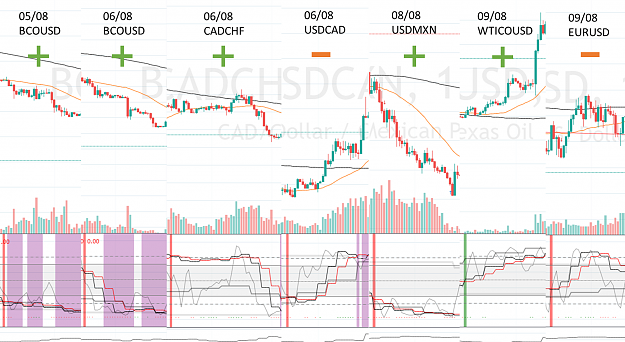
Once the markets have been shortlisted, I move the 15M charts with my own system which is based on momentum at three different resolutions; 15M (K2), 1H (K1) and 3H (K3). There are inherent ‘repaint’ issues that must be addressed when dealing with data at different resolutions – explained later.
When looking for trend continuation in a downtrend, I want to see good downward momentum with a tight pull-back and a way to confirm continuation. I do this by waiting for a specific setup structure.
The following structure must be met for a valid setup: K3 must be within the range of 20 – 30 (short) and 70 – 80 (long), K2 must then reach the relevant upper/lower bound (>80/<20), followed by a K1 crossover. The dots along the bottom confirm where K2 is aligned with K1, dots do not appear where K2 is in the upper/lower bounds and K1 is not – this is to avoid opening a position where a reaction to K2 may cause a short-term pull-back. The setup structure must form with a K2 direction dot at the XX:45 close to confirm a setup. I give K2 another hour to align if it is not aligned at the initial setup structure.
Attached Image (click to enlarge)
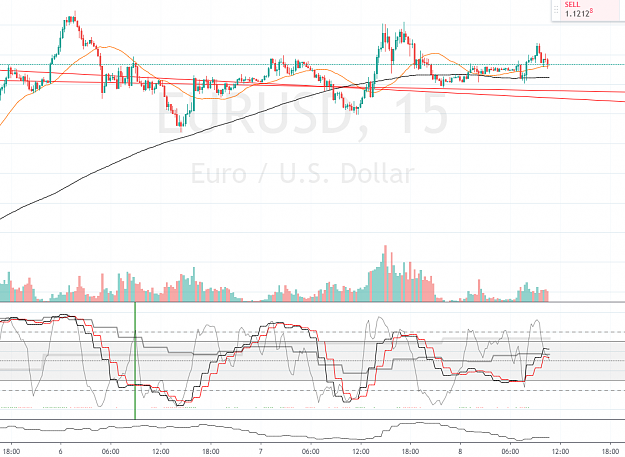
This setup structure allows me to only enter trades where there is data-backed momentum. If a market flattens out it is reflected in the data and signals are not created which does an okay job of keeping you out of tight ranges on the lower timeframes.
I address repainting caused by multiple timeframe data by referencing the confirmed points. All setups are confirmed; thus, trades are made hourly. K3 referencing uses the last confirmed value for hour-1 and 2 and the current K3 value for hour-3.
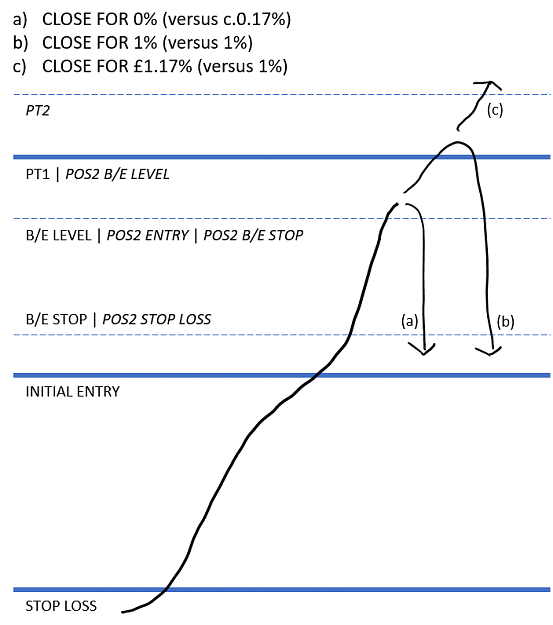
Stop losses and profit targets are set based on the 1H ATR. I like this method as it provides dynamic levels that are suited to the market in question. I have experimented with several ATR multiples and 3-times 1H ATR works best for me and typically provides a stop level that surpasses the 200 15M SMA.
Once in a trade, an alert is set at 75% of the profit target, once the price surpasses this level, I move the stop loss to breakeven/0.25% profit. I do this for several reasons, including my targets are not based on market structure, I prefer to see small profits than zeros, spreads, and slippage.
Developments
- K3 Range Bounds: This is a recent development as I used to use the standard upper/lower bounds for all timeframes, whilst it performed okay, the number of trades were high where markets aligned which also led to larger drawdowns if multiple markets would reverse. The change is a stricter requirement for K3 and leads to setups with tighter pullbacks and lower overall exposure.
- Over-Extension Check: I have always used the daily BB to gauge over-extension, but I did trade the over-extended markets but at lower risk. However, over time I noticed that the de-risked trades equated to a small net loss. Removing them resulted in a slighter higher return and fewer trades.
Next Steps
I am looking to automate some parts of the plan, for example; shortlisting to be completed automatically which updates a list of markets within the required range. This sounds like something that could be accomplished with minimal effort.
Please send me a private message if you have any experience with Pine Script Strategies and feel you could assist with the development of this strategy.
Feel free to share your thoughts. Cheers.
p=mv