The EU,H1 chart below illustrates the same type of retail trader behavior yet again. (For anybody new to this thread, the plots on the chart were created by software — that can be downloaded for free from post #1 — that scrapes retail trader data from myfxbook's community page: https://www.myfxbook.com/community/outlook).
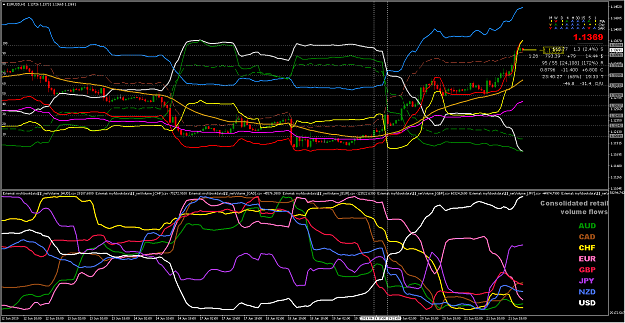
EU has been rising following the unexpectedly dovish Fed 48 hours ago. But retail is typically unimpressed by trends created by FA. Instead — for better or worse — it looks to trade counter trend, in the face of probable market drivers, by attempting to sell at what it guesses might be highs, and likewise buy at lows.
To the chart: Retail buy volumes on EU (the solid green line on the main chart) drop significantly in the hour following the green candle immediately prior to the second dotted vertical line. This was the time of the Fed release. Note how selling volumes (solid red line) follows price with uncanny accuracy all the way up, lagging by an hour or two as it takes retail traders time to react. The dashed green and red lines show the % of volume that is long and short respectively (see the scale at the LHS). Buy volumes have fallen from above 80% to below 10%, a total U-turn, and entirely against the price move. The solid silver line is the net retail volume (long minus short), and further highlights the counter trend nature of the retail mindset. The yellow line is the total retail volume (long+short).
The solid light blue and magenta lines represent the average retail buying and selling prices, respectively. Note how both are currently under water. The average selling price has increased as more retail traders sell at the then current price. I understand that many traders add to existing losses by averaging down.
In the chart subwindow, you can see how this affected the total USD (white line) and EUR (pink line) volumes. The EUR volume mirrors the selling volume in the main chart. The correlation between currencies and major pairs is very high all the way across the chart, for obvious reasons.
This retail behavior isn't just frequent, it happens continuously and with predictable regularity. If the goal in fx was to predict increases and decreases in retail volumes ahead of time, obtaining risk-free returns would be child's play. However, for better or worse, the retail traders occasionally profit (and likely at the expense of some contrarians who are attempting to oppose them), if the market oscillates sideways in a way that allows their averaged down entries to reach breakeven and beyond.
Two advantages offered by the study of retail behavior over TA: (1) it is a measure that is genuinely independent of price (whereas all technical indicators and line studies are derived from price); (2) retail volumes provide one value that's independent of timeframe, whereas with TA you potentially find uptrends, downtrends, or sideways moves in different TFs, or other simultaneous conflicting reasons to buy and sell.
Conversely, some good news for skeptics: if you'd ignored retail volumes, and simply bought when the EMA(34) (the solid ochre line) turned upward at the first dotted vertical line, you'd have front run the 'contrarians' by about 4 hours, and currently been up 150+ pips, by merely using a very simple trend following approach. And you'd have beaten the savvy FA trader who traded the Fed outcome, by a similar margin. Perhaps the 'market' anticipated the Fed, or perhaps heavyweight traders created net buying pressure a host of other unknown reasons.
Of course we could combine both TA and contrarianism by buying while the EMA is rising and the silver line in the main chart is falling; and vice versa for selling.
For more examples, and an in-depth analysis of retail behavior, read the PDF attached to post #1.
Attached Image (click to enlarge)
7