Trading can be very simple when you do it properly.
You need a general direction to trade in, you need to find a movement in price that happens over and over again, and more importantly, this movement needs to offer enough opportunity to make a nice return.
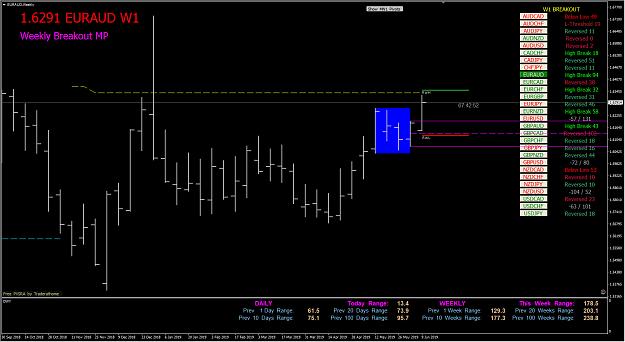
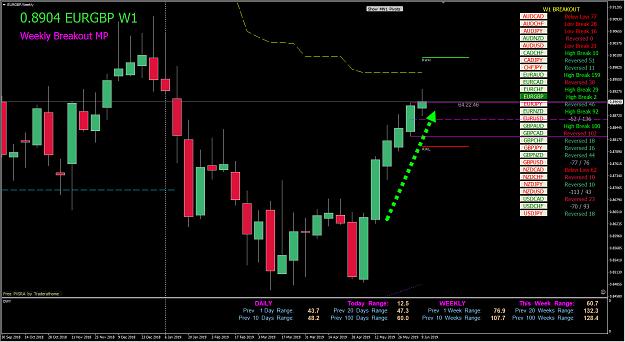
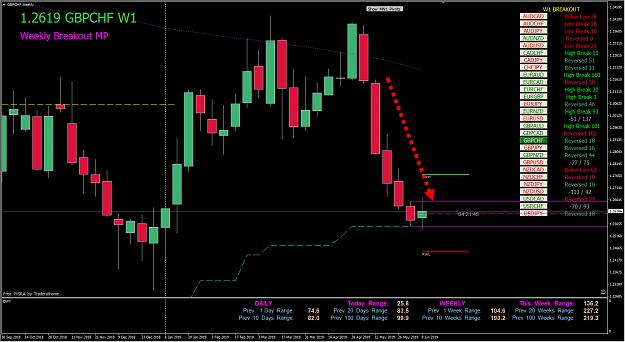
A perfect example of this is the price breaking its previous high and low of the last week.
Take the two graphs below.
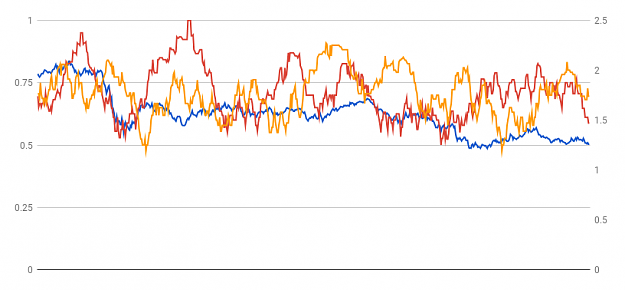
The blue in is the weekly closing price. The red line is the probability of breaking last weeks high when the last week closed positive on the week. The orange line is the probability of breaking last weeks low when the last closed negative on the week.
The first graph is of EURUSD, the second is of GBPCAD.
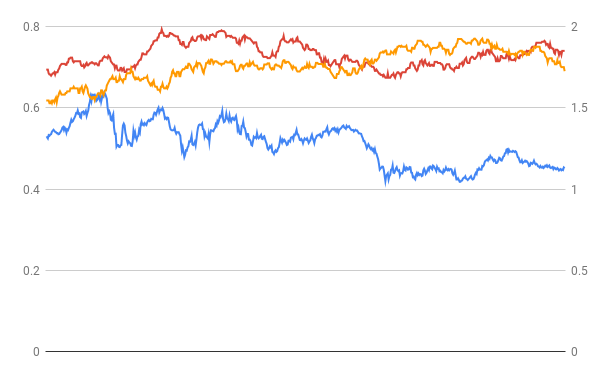
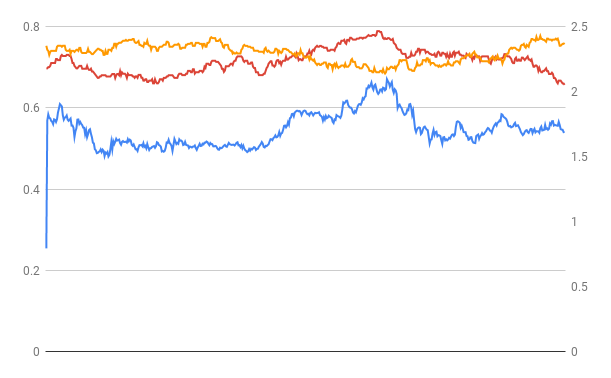
The probabilities are essentially the same. The hit rates oscillate between 65%-80% depending on how trendy the market is in one direction or the other, but usually hangs around 67%-72%.
So this gives us a direction to trade each week, and a profit target that has at least a 65% chance of being reached eventually.
Next, we need to look at a smaller time frame, something like the 1 hour chart. At this point, you can use whatever traditional indicators/entry signal you'd like. Whatever you use, you want to look for setups that meet 2 requirements:
1. The risk reward ratio is 2 or larger.
2. The total range of the setup is 100 pips or greater.
The reason you we require a risk reward ratio of 2 or larger is this means we only need to be right more than 33% of the time to make money in the long term, trading towards a target that has a 65-70% chance of being hit eventually. This gives us at least 2-3 opportunities to capture that move, and still make money over the long term.
In addition to this, I also like to factor in fundamentals and market sentiment and only trade in the direction of those as well. I will breakdown how I approach this at a later date.
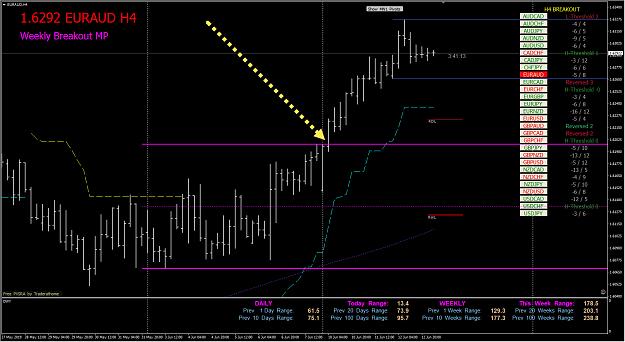
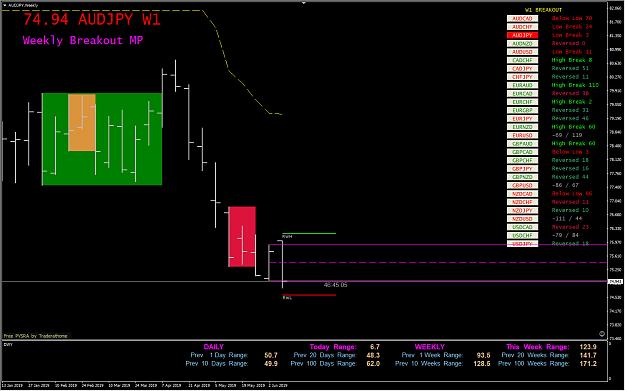
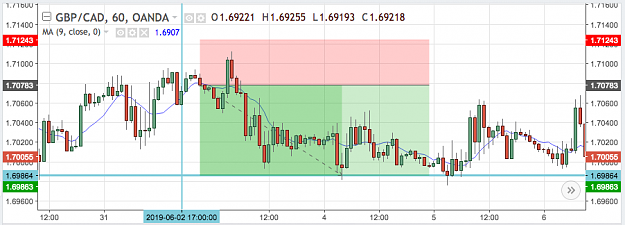
Here is an example trade from a few weeks ago on GBPCAD using a 2 bar engulfing pattern with a risk reward ratio of 2. The total range of the setup was about 130 pips. The blue horizontal line is the low of the previous week, which had at a minimum, a 66% chance of being hit the following week. The blue verticle line is the start of the next week.
Once the week starts, start stalking the market for an entry price toward your target, and ONLY trade towards your target, making sure your setup meets the 2 requirements listed above.
I will get around to posting stats on all 28 major pairs.
I will also be posting the setups each week I am going to be stalking.
Remember, you can't predict price. All you can do is understand its behavior and stalk it like a cheetah chasing a gazelle.
You need a general direction to trade in, you need to find a movement in price that happens over and over again, and more importantly, this movement needs to offer enough opportunity to make a nice return.
A perfect example of this is the price breaking its previous high and low of the last week.
Take the two graphs below.
The blue in is the weekly closing price. The red line is the probability of breaking last weeks high when the last week closed positive on the week. The orange line is the probability of breaking last weeks low when the last closed negative on the week.
The first graph is of EURUSD, the second is of GBPCAD.
Attached Image
Attached Image
The probabilities are essentially the same. The hit rates oscillate between 65%-80% depending on how trendy the market is in one direction or the other, but usually hangs around 67%-72%.
So this gives us a direction to trade each week, and a profit target that has at least a 65% chance of being reached eventually.
Next, we need to look at a smaller time frame, something like the 1 hour chart. At this point, you can use whatever traditional indicators/entry signal you'd like. Whatever you use, you want to look for setups that meet 2 requirements:
1. The risk reward ratio is 2 or larger.
2. The total range of the setup is 100 pips or greater.
The reason you we require a risk reward ratio of 2 or larger is this means we only need to be right more than 33% of the time to make money in the long term, trading towards a target that has a 65-70% chance of being hit eventually. This gives us at least 2-3 opportunities to capture that move, and still make money over the long term.
In addition to this, I also like to factor in fundamentals and market sentiment and only trade in the direction of those as well. I will breakdown how I approach this at a later date.
Here is an example trade from a few weeks ago on GBPCAD using a 2 bar engulfing pattern with a risk reward ratio of 2. The total range of the setup was about 130 pips. The blue horizontal line is the low of the previous week, which had at a minimum, a 66% chance of being hit the following week. The blue verticle line is the start of the next week.
Attached Image (click to enlarge)
Once the week starts, start stalking the market for an entry price toward your target, and ONLY trade towards your target, making sure your setup meets the 2 requirements listed above.
I will get around to posting stats on all 28 major pairs.
I will also be posting the setups each week I am going to be stalking.
Remember, you can't predict price. All you can do is understand its behavior and stalk it like a cheetah chasing a gazelle.