{quote} search 2 Period RSI pullback trading strategy by Connors
Ignored
https://www.tradingview.com/wiki/Connors_RSI_(CRSI)
I didn't find any shared mq4 or mq5 code for this. Anyone aware of something already coded?
================ There are three major components to Connors RSI
RSI = Standard RSI developed by Wilder. This is typically a short-term RSI. In this example it is a 3 Period RSI.
UpDown Length = The number of consecutive days that a security price has either closed up (higher than previous day) or closed down (lower than previous days). Closing up values represented in positive numbers and closing down is represented with negative numbers. If a security closes at the same price on back to back days, the UpDown Length is 0. Connors RSI then applies a short-term RSI to the UpDown Streak Value. In this example it is a 2 period RSI.
ROC = The Rate-of-Change. The ROC takes a user-defined look-back period and calculates a percentage of the number of values within that look back period that are below the current day price change percentage.
The final CRSI calculation then simply finding the average value of the three components.
Thanks, velgengni
That was pretty old code and as it was, wouldn't draw, and got array out of range errors. This was due to no code to check the minimum required bars when setting the first bar to check. Anyway, I modified it, attached, seems to reliably execute.
I'm not sure the code is 100% true to the description on tradingview.com, and the indicator seems to seldom exceed 5 and 95 - but the guys at forex-std certainly have more time and expertise than I.
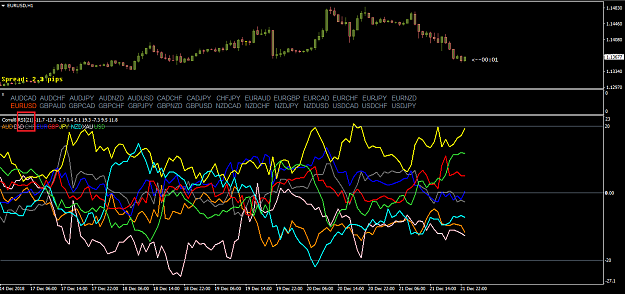
Do you use rsi to gauge trends? I found that using rsi, we can catch trends easily. {image} {image} Rsi can be very fast, but using multiple timeframe approach definitely helps. You can see at the right hand side of the first chart - the trends remain down for the whole time. The way to do this is if rsi below 50 - the trend is down. if rsi above 50 - the trend is up. The period can be 11 or 13. What i wanted to know is - is there anybody else using rsi to deternine trend? Any sharing would be appreciated.
Ignored
I will like to share my past experience of using RSI even tho I had long ditched it. This momentum indicator is lagging and price always preceded its reading which rendered it ineffective to read PA correctly and timely except to show that price have already moved. However it can be used to detect fakeouts and divergences. The only thing about divergence is even tho all reversals show momentum divergence but not all divergences indicates reversal. Therefore in view of the various limitations to correctly read price in a timely and correct manner, it is at best just a secondary tool and cannot be use to trade with it alone in the various PA context.
Trend is another separate entity altogether and it is only possible to detect them effectively if you are able to read them in a proper PA context. There are trend in pullback, retracements, and also in intraday, short term, mid term and long term time frames. Therefore trend is always dynamic and fluid and it depends on which PA context you are referring to and how to read them accordingly in the different context. Trading with the trend means if PA is in pullback mode then trade the pullback if you must and if in replacement trade the replacement and not otherwise. Few can trade them successfully because often a pullback or a replacement can morphed into a reversal if one does not know the parameters of all the different PA context. This is the single and biggest challenge faced by all traders.
Just sharing my trading experience.
The RSI is a nice tool when properly calculated. Since you like it, then probably you should use the TDI instead. It is an RSI with trend lines and standard deviation added to it to make it more effective. Personally, I would use one that updates on each tick. The original updates on candle close. I have attached a real-time version.
I prefer CCI indicators instead of RSI indicators; however, you can use either to see cycles. I think the RSI is less prone to divergence, or in other words, a trade signal that opposes actual movement, like the notorious MACD does frequently.
You might notice on some RSI, TDI, or QQE indicators, the value of the period setting does not change the signal line shape. It changes its placement within the levels. This condition allows you to adjust your periods against a level signal, rather than an internal line crossover. You can bypass the 32, 68, 30, 70, or whatever levels, and instead create levels that align to the market and your strategy. When properly set, the signal line cycling inside your level control limits will generally identify consolidation. When the signal line is outside the levels, it generally means a trend or a range with enough strength to trade. Once the signal retraces to the level line, the trade ends. This is an easy way to trade only the vertical movement and ignore the flat areas. Dean used Fibonacci numbers when he made his version, so feel free to change any value (and color) to what it should be for your design. Just like the standard meta trader indicators are wrong, so are most custom indicators too, lol. Some, like the Fisher, have even had the math code altered. Sinister, lol. Don't be in the 95%.
Also, since you wrote this thread in March, you have probably noticed there is a difference between historical charts and live trading. Contrary to what novices like to write, most indicators update on each tick and are not lagging anymore than a candle lags, lol. So the signal you get in real time will alter its shape as more periods are calculated in the future. Adapt and overcome. Good Luck.
I only look for trend-following trades but I avoid all off-chart indicators like RSI. Reasons are that they don't provide any information I absolutely must have before the trade, and what they tell me I can get from the price chart anyway. The particular trend gauge you have imposed on the RSI - i.e. 50+ is an uptrend, 50- is a downtrend - is artificial: the reality is that most of the time, price isn't trending at all, so a binary up/down measure is bound to lead you into confusion. I'm not a pure price action trader, I do use EMA's.
Ignored
I wouldn’t use EMA’s either, stick to just SMA’s. They test with good profitability, EMA’s don’t.
Trading thin liquidity at the boundary of the charts