Greetings Traders. This is my first thread so please be kind.
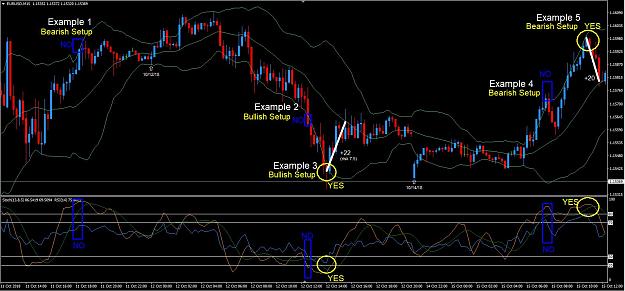
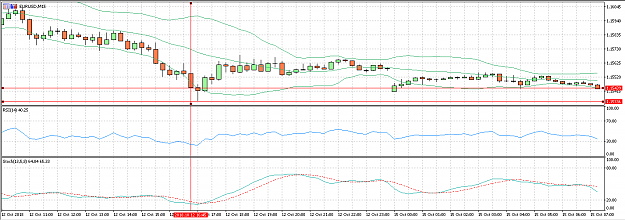
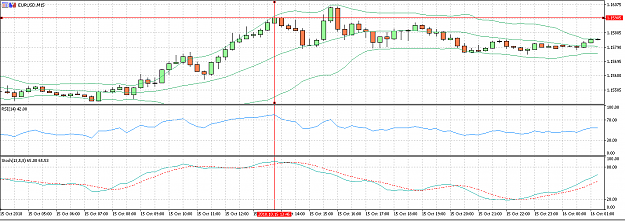
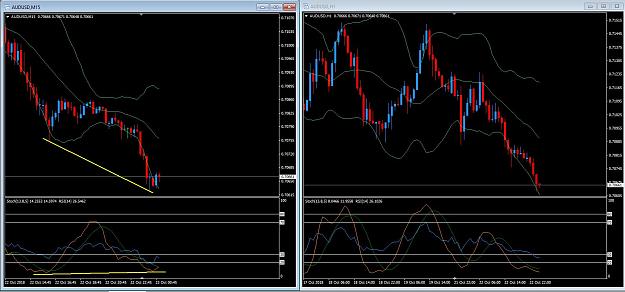
This is a simple system. I like a 15 minute chart for 10 pips a day... but often this time frame can produce 20 or more per trade.
The pictured example is a fifteen minute chart.
When the rules are followed I experience about a 75% win rate, with very low risk.
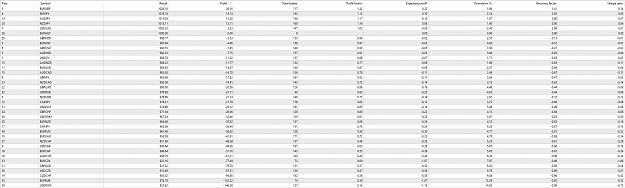
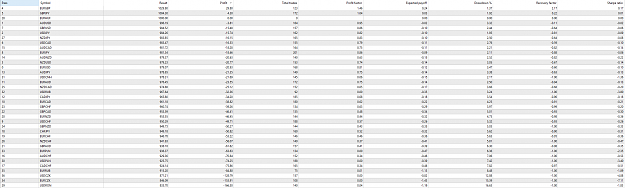
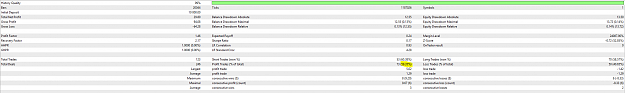
I have backtested 500 trades, strategy tested 250, and demo traded 100 trades.
I am bringing it live on a small real account now and have my trade explorer attached for your review.
STOCHED UP RSI
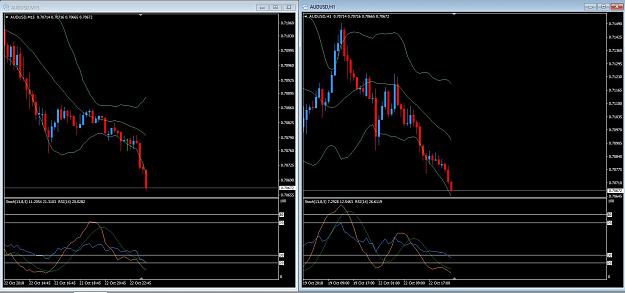
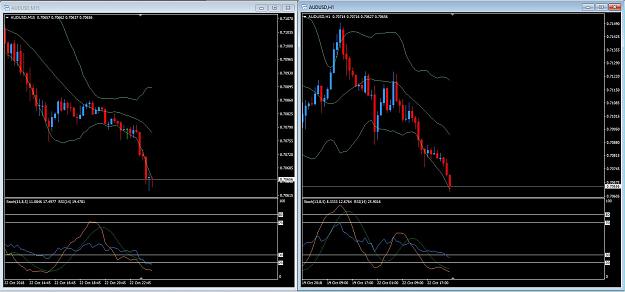
Currency Pair: ANY
Timeframe: ANY
INDICATORS
Bollinger Bands (21) - Deviations (2)
Stochastics (13,8,5) - Levels: 20,30 and 70,80 - Slow Line green, fast line orange
RSI (14) overlaid on to Stochastic, no levels - Light blue color
BULLISH SET UP RULES:
Price closes at or below the lower Bollinger band
Stochastic fast line AND slow line are both below the 20 level
RSI is below the 30 line
Enter at candle close
Target is middle Bollinger band
BEARISH SET UP RULES
Price closes at or above upper Bollinger band
Stochastic fast line AND slow line are both above the 80 level
RSI is above the 70 line
Enter short at candle close
Target is middle Bollinger band
RISK
Varies on timeframe... I start with about a 10 pip risk on a 15 minute chart, and risk goes up as timeframes go up.
As price moves my direction, I will trail my stop producing very low risk trade ideas
RISK DISCLAIMER
test and demo trade before applying this strategy to a live account. All trading poses serious financial risk, including loss of capital.
This strategy is shared with you for free... Be wise and use due diligence when trading this or any strategy.
This is a simple system. I like a 15 minute chart for 10 pips a day... but often this time frame can produce 20 or more per trade.
The pictured example is a fifteen minute chart.
When the rules are followed I experience about a 75% win rate, with very low risk.
I have backtested 500 trades, strategy tested 250, and demo traded 100 trades.
I am bringing it live on a small real account now and have my trade explorer attached for your review.
STOCHED UP RSI
Currency Pair: ANY
Timeframe: ANY
INDICATORS
Bollinger Bands (21) - Deviations (2)
Stochastics (13,8,5) - Levels: 20,30 and 70,80 - Slow Line green, fast line orange
RSI (14) overlaid on to Stochastic, no levels - Light blue color
BULLISH SET UP RULES:
Price closes at or below the lower Bollinger band
Stochastic fast line AND slow line are both below the 20 level
RSI is below the 30 line
Enter at candle close
Target is middle Bollinger band
BEARISH SET UP RULES
Price closes at or above upper Bollinger band
Stochastic fast line AND slow line are both above the 80 level
RSI is above the 70 line
Enter short at candle close
Target is middle Bollinger band
RISK
Varies on timeframe... I start with about a 10 pip risk on a 15 minute chart, and risk goes up as timeframes go up.
As price moves my direction, I will trail my stop producing very low risk trade ideas
RISK DISCLAIMER
test and demo trade before applying this strategy to a live account. All trading poses serious financial risk, including loss of capital.
This strategy is shared with you for free... Be wise and use due diligence when trading this or any strategy.
Attached Image (click to enlarge)