Nut can you explain why you used that level the 0 level to draw the fib in post 288. It seems to be in the right place, but im curious because you choose a level that for me could easily passed unnoticed, i would probably look for the 100 or the 38 level because there appears to be some support resistance there and if i did that i would end with the fib draw in the wrong place.
Ignored
Hi, if you start at post number1 you will see I am using complete swings. This caused confusion for some people so to try and simplify things I introduced a system using the last bar in the swing and working from there. In the end it is all the same as the basic model relies on the same ratio's. Using the swing is just more efficient.
As you will notice that is the only swing I could use there are no earlier pullbacks in price, had there been I would have chosen the first swing. Alternatively, I could have used the length of the last bar.
Thanks for the reply Nut, just one more question to see if im seing things clear, lets use the example in the video in post 151. There is an uptrend and you keep placing your golden mean levels, at some point price fails to go to the next golden mean and finds resistance at 38.2 level and support at the previous golden mean level. Do you from here assume that the up move might be over and that the move is completed 61.8+38.2=1 and that if price breaks the previous golden mean to the downside could be a strong indication that the move is indeed completed and price will continue to go lower. Hope this makes sense to you and that im seing things clear.
{quote} This is my own interpretation of Fib's. I adapted the model of the golden mean to fit my needs as this relationship is mathematically correct. Regards Nut
Ignored
I believe there was a book that described this very fib relationship by Ed Dobson several decades ago (~1994) titled, "The Trading Rule That Can Make You Rich". I never could figure out how to apply it, so thanks for your posts Nut.
{quote} I believe there was a book that described this very fib relationship by Ed Dobson several decades ago (~1994) titled, "The Trading Rule That Can Make You Rich". I never could figure out how to apply it, so thanks for your posts Nut. Watson
Ignored
I must search for that book it could be interesting and perhaps informative, several decades ago 1994!! that was just yesterday.
Don't look too hard for it as I think I mis-remembered (like W). It was more likely Duffy's book, "Turning Points in Price and Time". These days when I do remember, I usually mis-remember - CRS disease.
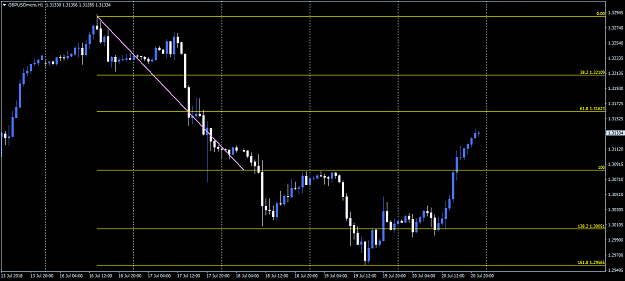
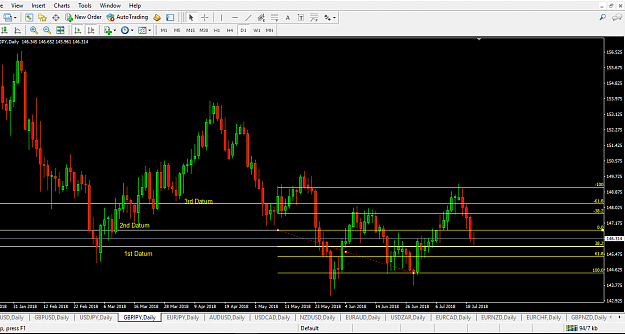
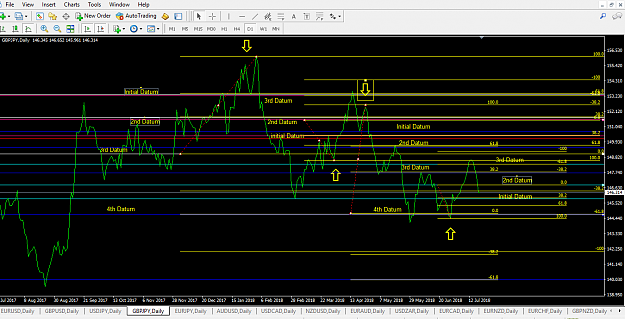
Let us try to clear this up using a one hour chart. Step 1 Choose a point for a datum Step 2 Place your fibs by measuring from the low to the datum. Step 3 Place another datum on the 61.8% Step 4 Set your fib to measure to that 61.8% Continue to walk up the 61.8 levels and eventually you will hit support/resistance. When choosing an initial datum I find from the last low to the last high works well. {image} {image} {image} {image}
Ignored
Hi Nut, do you have a strategy around this method. When price crosses a 61.8 and you move your datum are you looking for a pullback to a fib level and taking a trade in the direction of the trend? Or are you just looking for a reversal at the 38.2 to take a trade in the opposite direction?
Thanks for the reply Nut, just one more question to see if im seing things clear, lets use the example in the video in post 151. There is an uptrend and you keep placing your golden mean levels, at some point price fails to go to the next golden mean and finds resistance at 38.2 level and support at the previous golden mean level. Do you from here assume that the up move might be over and that the move is completed 61.8+38.2=1 and that if price breaks the previous golden mean to the downside could be a strong indication that the move is indeed completed...
Ignored
Yes, you are seeing things correctly, however, it is only implied a reversal might happen I have undertaken no statistical analysis to prove or disprove this hypothesis. I study the price action to decide one way or the other. Sorry I cannot help more.
Regards
Nut
{quote} Hi Nut, do you have a strategy around this method. When price crosses a 61.8 and you move your datum are you looking for a pullback to a fib level and taking a trade in the direction of the trend? Or are you just looking for a reversal at the 38.2 to take a trade in the opposite direction?
Nut thank you for sharing this method and taking the time to help, since it doesn't seem to be a great interest in this thread no more i would advice people to start from page 1 and read it all again, there is a lot here. Here is something that resumes this week very well.
Joined Jan 2018
|
Status: paradigm shift =profit shift
|52 Posts
Thanks with a new approach
1.I trade the daily time frame should I consider Elliot Wave,weekly tf and monthly tf?
2.Can I use the method in the ranging market?
3.Am I right to say the stoploss is placed above/below 38.2% and my first entry is the break of my datum
The aim of these questions is not to be spoon fed but for clarity reasons to make sure the understanding is the same or not wrong use the method.
Thanks with a new approach 1.I trade the daily time frame should I consider Elliot Wave,weekly tf and monthly tf? 2.Can I use the method in the ranging market? 3.Am I right to say the stoploss is placed above/below 38.2% and my first entry is the break of my datum The aim of these questions is not to be spoon fed but for clarity reasons to make sure the understanding is the same or not wrong use the method. Thanks
Ignored
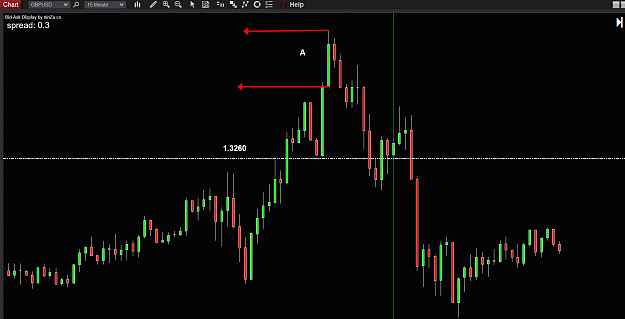
you should look at the levels and try to figure what they can tell you.
In the image i posted price failed to break the datum what does that tell you? price reversed and broke the previous datum level what does that tell you? Next you should look at what price does in the next levels, the 61 and 38 and see what those levels can tell you
Thanks with a new approach 1.I trade the daily time frame should I consider Elliot Wave,weekly tf and monthly tf? 2.Can I use the method in the ranging market? 3.Am I right to say the stoploss is placed above/below 38.2% and my first entry is the break of my datum The aim of these questions is not to be spoon fed but for clarity reasons to make sure the understanding is the same or not wrong use the method. Thanks
Ignored
I studied Elliot for a long time, before the days of computers so all wave counts were manual. The best Elliot did for me was to tell me where the market had been and not where it was going. Information at that time on Elliot was scarce and was used as a method of selling useless books on the subject. Perhaps it is different now with the internet.
If I were to starting again with my experience, then I think Wyckoff would be my choice, another big subject easier to learn and follow. Wyckoff certainly takes the long-term view.
Stops are a contentious subject with everybody taking a different approach. I suggest you place your stops based on your own tolerance to risk and current analysis.