Hi,
most indicators want to show us two ways: Either price is going up > uptrend, or price is going down > downtrend.
But there are also indis that try to show a third middle way, the flat trend.
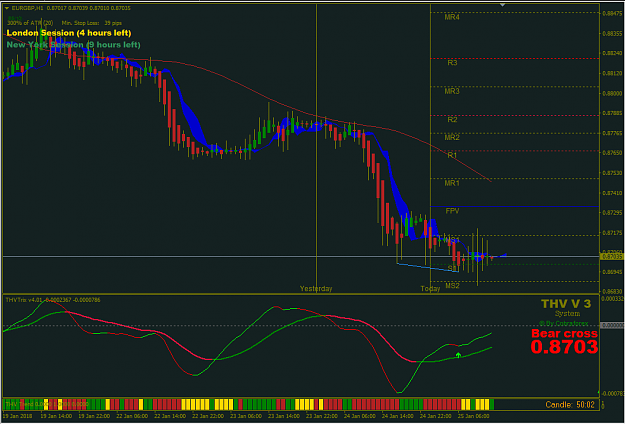
As I have seen in some Moving Averages, which - between red and green - turn into yellow.
For ex. in the old THV thread there was that MA from cobra... or MissPips coded it in a seperate window, at down of the chart
Of course there are also different indis/oscillators that show us some retracement, price is consolidating and taking a range.
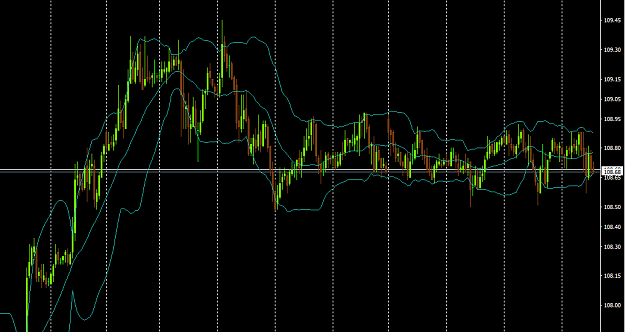
But how do you want to - for ex. - use Boll Bands for giving you signals?! [When the bands are tight to some point, but how can I get this implemented into an EA?! - especially when I don't just want to rely on whether bands are touching candles or not]
I search for an indi that gives me range signals...
if you have some ideas, I would appreciate it much!
most indicators want to show us two ways: Either price is going up > uptrend, or price is going down > downtrend.
But there are also indis that try to show a third middle way, the flat trend.
As I have seen in some Moving Averages, which - between red and green - turn into yellow.
For ex. in the old THV thread there was that MA from cobra... or MissPips coded it in a seperate window, at down of the chart
Attached Image (click to enlarge)
Attached File(s)
Of course there are also different indis/oscillators that show us some retracement, price is consolidating and taking a range.
But how do you want to - for ex. - use Boll Bands for giving you signals?! [When the bands are tight to some point, but how can I get this implemented into an EA?! - especially when I don't just want to rely on whether bands are touching candles or not]
Attached Image (click to enlarge)
I search for an indi that gives me range signals...
if you have some ideas, I would appreciate it much!
Check page 1 for all infos...