Are you in a fast-market or a just a fast run on your pair? Did country X just threaten war on country Y (and you don't know it yet) or is a market-maker just pulling a fast one? Are the markets making a major trending move? Are they vigorously consolidating? These are the questions this indicator aims to answer to save you decision-making-time and pips.
The idea behind this indicator: a fast run on a pair will only effect a few pairs (most one major and minor crosses) and can be determined by low volume and lack of movement on the other majors. Conversely, a major market event will increase volume and movement across all of the majors.
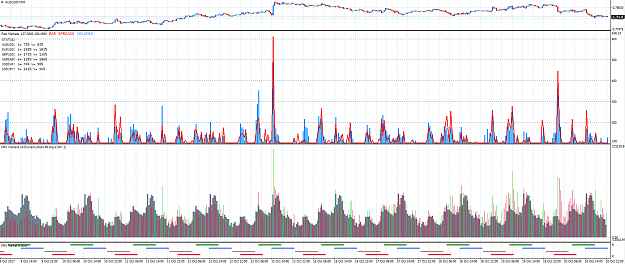
This indicator measures the average current volume and bar-spreads (high minus low) of all majors (M1 ideal) and compares the current volume to a n-period MA of volume and the average percent of spread to ATR. Whew... that's a lot of averages... To simplify it all, you are only seeing large spikes when vigorous market activity is detected in all the majors all at once.
This only works with ECN brokers with very active tick-data feeds. Do not use this with a fixed spread market maker and expect any meaningful results. The reason you will not get proper results is because MM brokers only update the tick when price has moved within a certain deviationof the wide spreads. If you trade with a MM and want to use this then I'd recommend downloading a demo from an ECN that provides an active feed.
How to interpret the results:
Assuming you are using an active feed, when you see the volume spike up while the spreads remain relatively low then this is signaling a highly active consolidating market. Spreads that spike up past volume can indicate a super fast moving market or a quickly gaping price on one of the majors. To the right of the indicator you will see zones marked 200+, this represent the percentage the market is currently trading at compared to the recent past. For example a spike to 400 means that current spreads and volume are 400% higher than the average of the past n-periods. It's important to understand that this indicator measures the rate of change in market dynamics. You could very well be in a very strong trending market with a lot of volume and the indicator shows no reading, this is because the market is currently 'business as usual'.
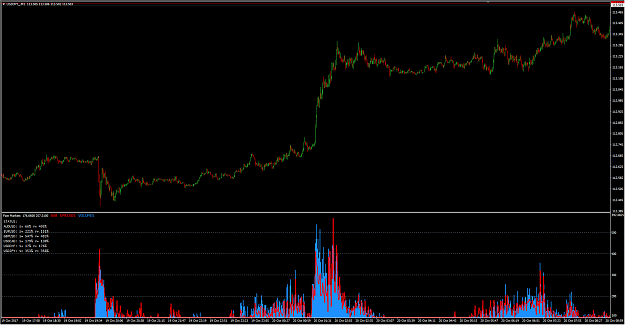
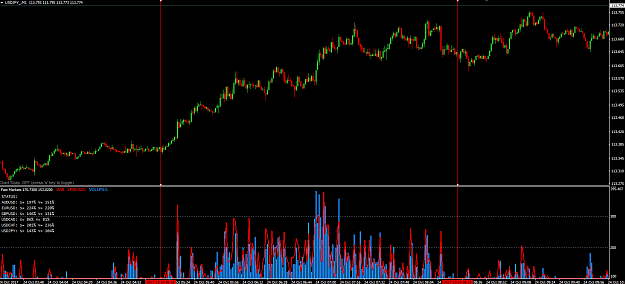
Older prototype on USDCAD release.
UPDATE 2017.10.25: Major update (FastMarkets2)
The idea behind this indicator: a fast run on a pair will only effect a few pairs (most one major and minor crosses) and can be determined by low volume and lack of movement on the other majors. Conversely, a major market event will increase volume and movement across all of the majors.
This indicator measures the average current volume and bar-spreads (high minus low) of all majors (M1 ideal) and compares the current volume to a n-period MA of volume and the average percent of spread to ATR. Whew... that's a lot of averages... To simplify it all, you are only seeing large spikes when vigorous market activity is detected in all the majors all at once.
This only works with ECN brokers with very active tick-data feeds. Do not use this with a fixed spread market maker and expect any meaningful results. The reason you will not get proper results is because MM brokers only update the tick when price has moved within a certain deviationof the wide spreads. If you trade with a MM and want to use this then I'd recommend downloading a demo from an ECN that provides an active feed.
How to interpret the results:
Assuming you are using an active feed, when you see the volume spike up while the spreads remain relatively low then this is signaling a highly active consolidating market. Spreads that spike up past volume can indicate a super fast moving market or a quickly gaping price on one of the majors. To the right of the indicator you will see zones marked 200+, this represent the percentage the market is currently trading at compared to the recent past. For example a spike to 400 means that current spreads and volume are 400% higher than the average of the past n-periods. It's important to understand that this indicator measures the rate of change in market dynamics. You could very well be in a very strong trending market with a lot of volume and the indicator shows no reading, this is because the market is currently 'business as usual'.
Attached Image (click to enlarge)
Older prototype on USDCAD release.
Inserted Video
UPDATE 2017.10.25: Major update (FastMarkets2)
- Makes index from all individual pairs that contain currencies form the chart pair. For example: GBPUSD on chart = index comprised of GBPJPY, GBPUSD, GBPCHF...and so on.
- Alerts added with tuning options.
- Symbols sorted in real-time by most active
UPDATE 2017.10.25: Minor update (FastMarkets2.2)
- Added button to toggle audible alerts.
- Fixed minor bug with alerts not sounding on spread gapping
Attached File(s)