Hi everyone,
I want to share a system which is probably very familiar to a lot of veterans here.
Its nothing new but I wanted to share it for those who are tired of losing from daytrading or even minutetrading
I've posted 3 different timeframe charts of the same pair to show you how I'm trading right now.
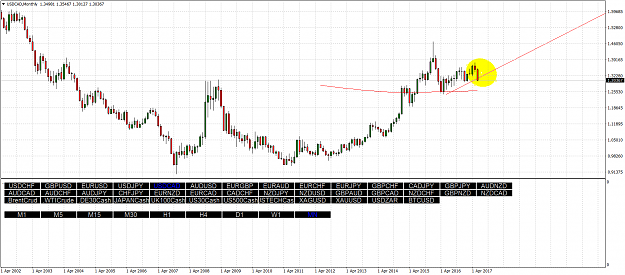
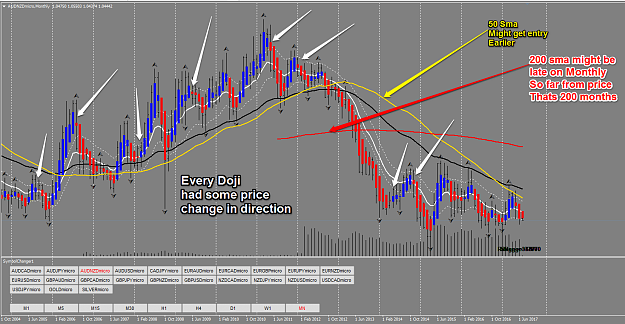
Basically you start off with the monthly. See if there is a trend in the monthly. This does not have to be a long term trend. You could have a monthly bar breaking the low or high of the last 2 months.
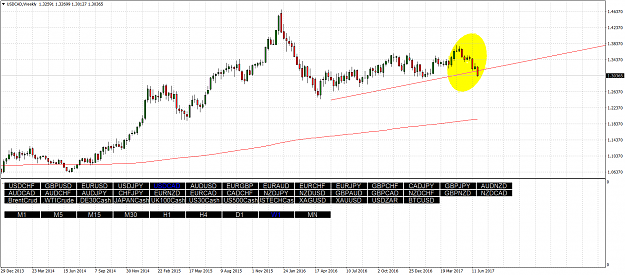
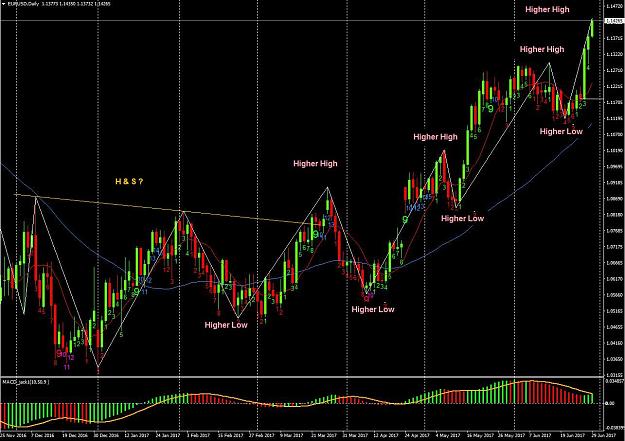
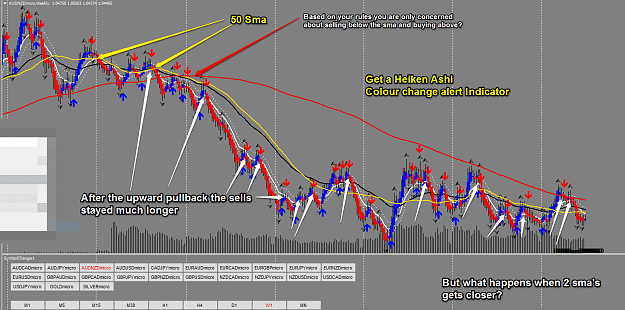
Second you check the weekly chart to see a trend already under way. HH LL etc.
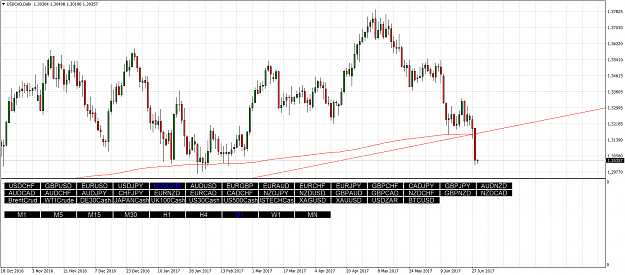
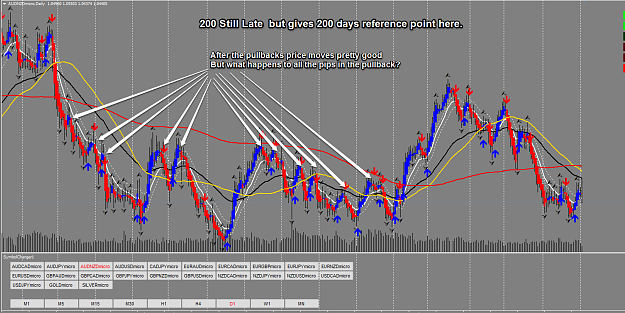
Third check the daily chart. This is your entry chart.
Now for the daily we should have a 200 sma on the chart(this is what the institutions use so its very effective).
If the daily is above the sma and the weekly is trending up than we go long and vice versa for shorts.
If the daily has just recently broken the sma and closed its even better.
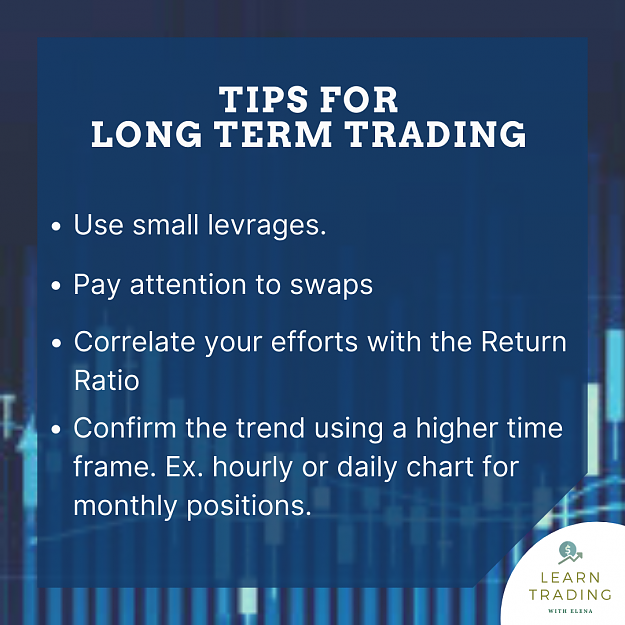
Risk only 2% of your account. I use 2% risk with 500 pip stop loss for each pair.
It is up to you to figure out your exit other than the sl.
Now don't trade this on live account. There is nothing proven here yet. So use it at your own risk.
I am trading live but with a small account.
I welcome any input.
I will let you know hot my account is going.
tnx
P.s. I forgot to say, In the usd/cad chart I would go short at the daily chart.
And also there are times(sometime a whole year) where the currencies fail to trend therefore you can use this system for stocks and other instruments as well.
I want to share a system which is probably very familiar to a lot of veterans here.
Its nothing new but I wanted to share it for those who are tired of losing from daytrading or even minutetrading
I've posted 3 different timeframe charts of the same pair to show you how I'm trading right now.
Basically you start off with the monthly. See if there is a trend in the monthly. This does not have to be a long term trend. You could have a monthly bar breaking the low or high of the last 2 months.
Second you check the weekly chart to see a trend already under way. HH LL etc.
Third check the daily chart. This is your entry chart.
Now for the daily we should have a 200 sma on the chart(this is what the institutions use so its very effective).
If the daily is above the sma and the weekly is trending up than we go long and vice versa for shorts.
If the daily has just recently broken the sma and closed its even better.
Risk only 2% of your account. I use 2% risk with 500 pip stop loss for each pair.
It is up to you to figure out your exit other than the sl.
Now don't trade this on live account. There is nothing proven here yet. So use it at your own risk.
I am trading live but with a small account.
I welcome any input.
I will let you know hot my account is going.
tnx
P.s. I forgot to say, In the usd/cad chart I would go short at the daily chart.
And also there are times(sometime a whole year) where the currencies fail to trend therefore you can use this system for stocks and other instruments as well.
Attached Image(s) (click to enlarge)