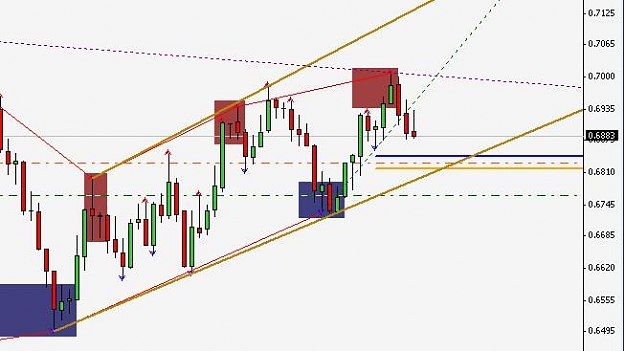
Here is an indicator that will mark stochastic areas on your chart. Based off of NewstraderFX's double stochastics idea.
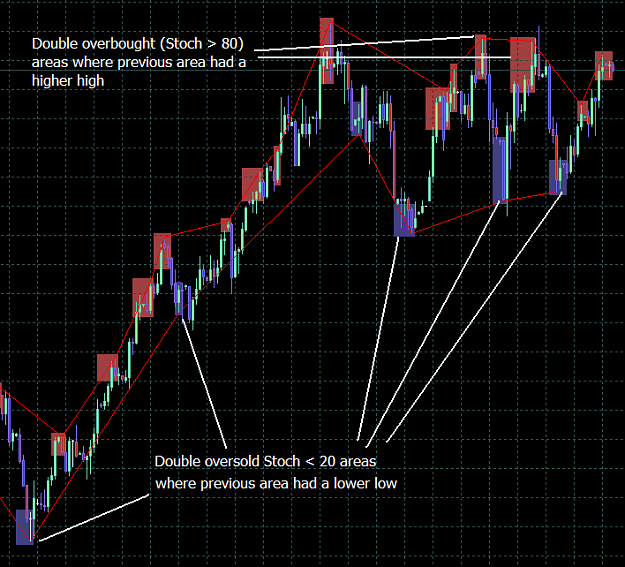
Here is his idea in a nutshell... You are looking for the stochastics going above 80 (overbought) or below 20 (oversold) twice in a row.
You are also looking for areas where the second overbought area has a lower high (or oversold area has a higher low).
The idea is that after that you will see a significant correction. Works better in the higher timeframes.
So this indicator will mark the overbought / oversold areas and link the higher highs / lower lows with a line so you can clearly identify an area where you can expect significant reversal.
Try GBP/JPY daily / H1...
for lower timeframes (M5) it will not work as good but is still a good confirmation.
Enjoy!
Attached Image (click to enlarge)
Attached File(s)