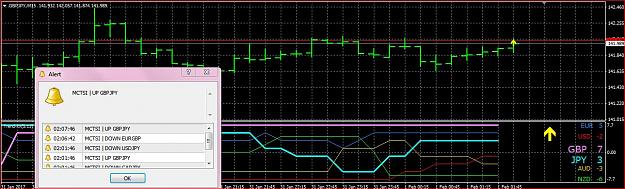
updated version with new name: MCTSI
- strength lines highlighted
- arrows on indicator windows
- arrows on chart
- alerting enabled
the basic formula is this:
measure the moving average (5,13) of a currency against all of the other currencies.
if it is up it gets a +1 , down -1
example
value ( +7 to -7) of USD is measured against : eurusd gbpusd usdchf usdjpy audusd usdcad nzdusd
if the value is say +5 , then the USD is stronger in 6 of the above currency pairs and weaker in 1. (+6-1)
or
-3 = stronger in 2 but weaker in 5 currencies. (+2-5)
the rate of change or rate of change strength is adjusted by the moving average numbers , IE 5,13
so make it 3,5 and it is very sensitive , 14,29 and it is a lot less sensitive to change.
imho 5,13 is a sweet spot , but Im hoping for some feedback from the community on all of this , and how it relates to the timeframes as well. btw the timeframe is taken from the chart that the indicator is placed on.
the other method that I have considered is just +1 if the measured currency is stronger , 0 if it is weaker , so you would end up with a strength meter of 0-7.
I have considered many other methods , one is to measure the actual price difference of the 2 moving averages , put that into a array and spit out the results - hmm or a combination of both or add in the RSI and or CCI, it goes on.
but of now I think this is something that can work and is tradeable.
so please post feedback and ideas
thanks
Attached Image
Attached File(s)