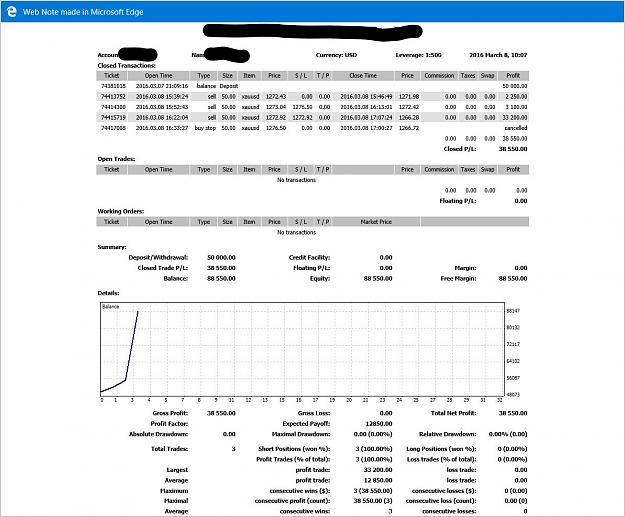
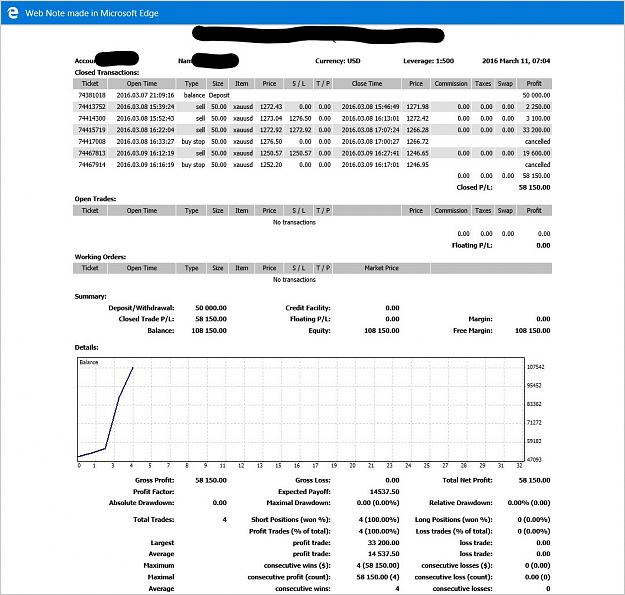
Tuesday March 8, 2016
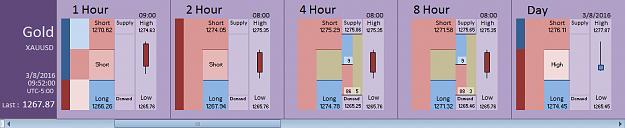
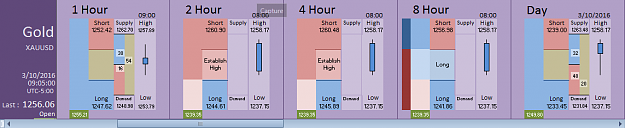
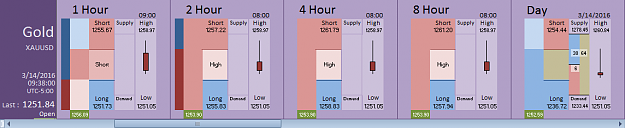
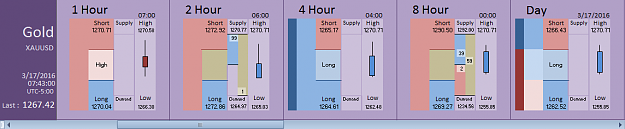
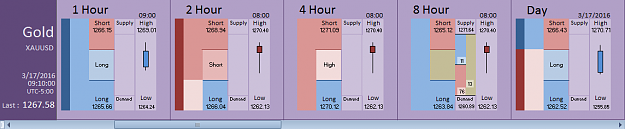
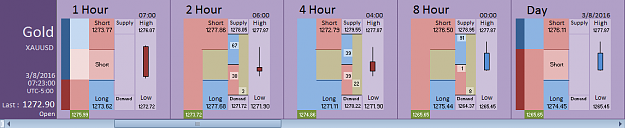
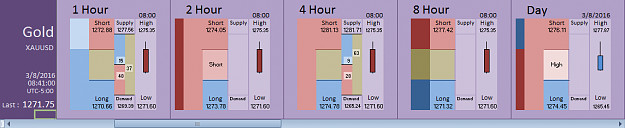
Chart #1: On the 1 Hour, the application indicates the market is forming a lower wick. Market direction remains Short while below 1273.77.
Chart #2: On the 2 Hour, the application indicates we have a High and the market is forming an upper wick. When the application indicates a High, market direction remains Short while below 1277.68.
Chart #3: On the 1 Hour, the application indicates the market has completed the lower wick and further indicates we now have a Low. The market remains Long while above 1272.46.
Chart #4: On the 2 Hour, the market is Short. We have a retracement level @1273.78.
Chart #5: On the 8 Hour, the market is now Short. We have a retracement level @1270.55.
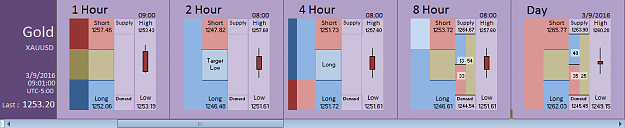
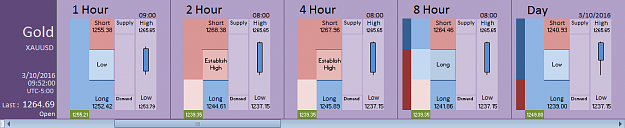
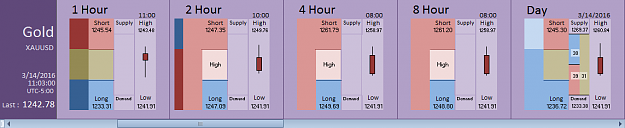
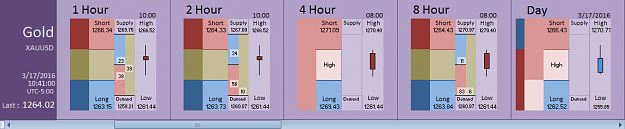
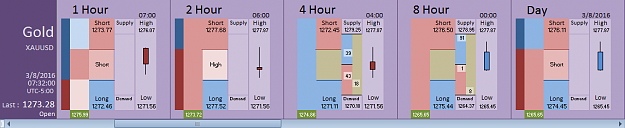
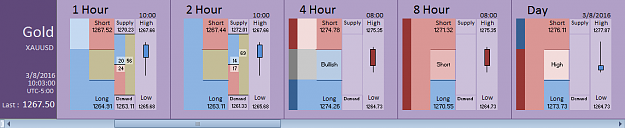
Chart #1: On the 1 Hour, the application indicates the market is forming a lower wick. Market direction remains Short while below 1273.77.
On the Day, the application indicates the market is forming an upper wick. Market direction remains Short while below 1276.11.
Chart #2: On the 2 Hour, the application indicates we have a High and the market is forming an upper wick. When the application indicates a High, market direction remains Short while below 1277.68.
Chart #3: On the 1 Hour, the application indicates the market has completed the lower wick and further indicates we now have a Low. The market remains Long while above 1272.46.
Chart #4: On the 2 Hour, the market is Short. We have a retracement level @1273.78.
On the Day, we have a retracement level @1274.45. Remember, on this timeframe the market remains Short while below 1276.11.
Chart #5: On the 8 Hour, the market is now Short. We have a retracement level @1270.55.
On the Day, the retracement level is now @1273.73.
Attached Image(s) (click to enlarge)
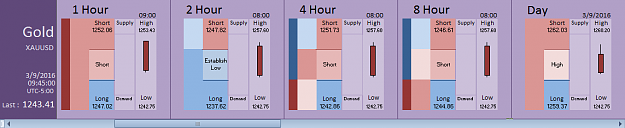
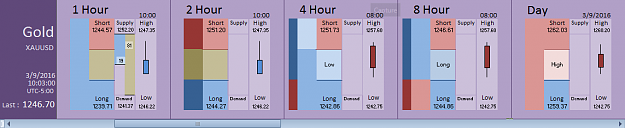
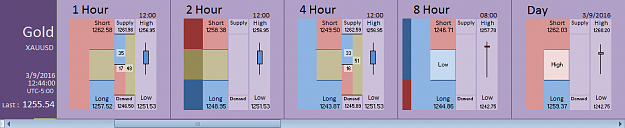
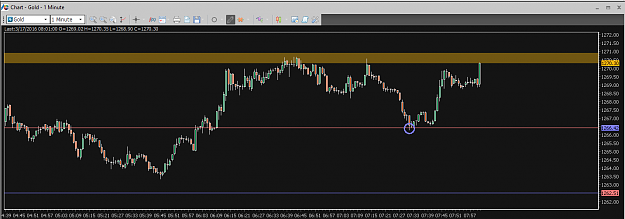
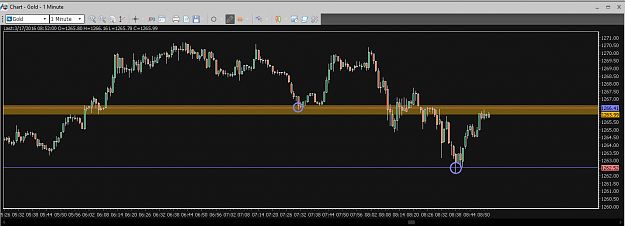
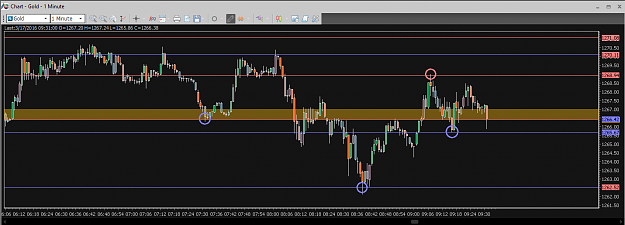
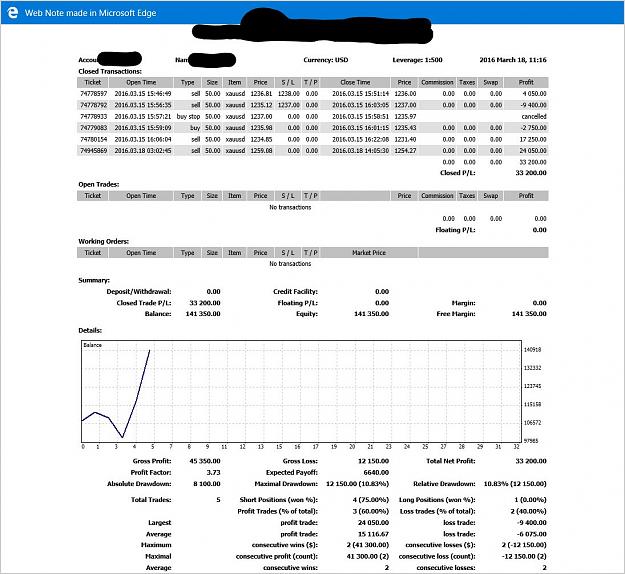
Using the FIA, traders need only "Sell the Highs" & "Buy the Lows".