Since almost 2 years I am trying to stay consistently successful trade.
And only couple months ago I have found the solution for myself. The key to success is psychology. 99% of success is psychology. No doubt about it.
The main question of psychology is emotions. Emotions is the main reason of the most mistakes, at least for me.
To be less emotional you have to be less risky. and you need time for thinking.
So, step by step I came to my system. But any way this not proven system yet. That's why I am starting this journal to try to formalize the rules, to collect statistics and to be able to make the work on mistakes.
In fact there is nothing new, everything was invented before - "Trend is your friend", "Buy low - sell high", "Trade what you see" etc....
The main question is interpretation. How to identify the trend? How to understand is it low or is it high? How to trade exactly what you see and how to be sure you see exactly this?
To answer this question we need system, rules, discipline, mental control, patience and experience.
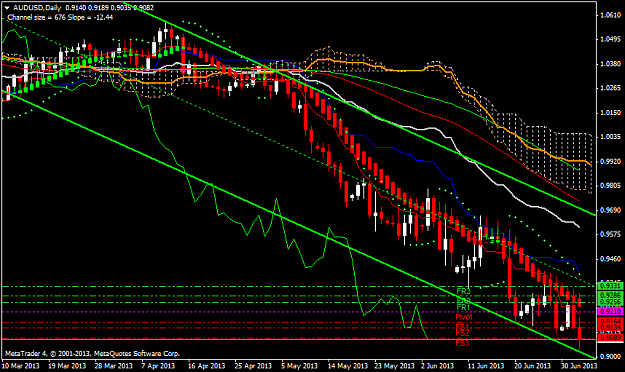
The inspiration to my system I have found from the system of Dr.Alexander Elder - Triple screen.
And from thread of SonicDeejay - Sonic R. system
The essence of system:
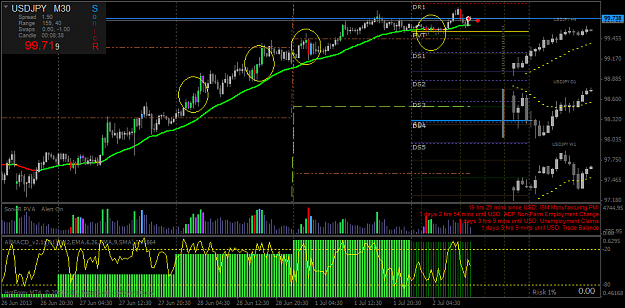
To identify trend at Higher time frame (HTF) and to catch pullback at Lower time frame (LTF) to add one m ore very small trade to position.
Sounds like very simple, but reality is not so easy.
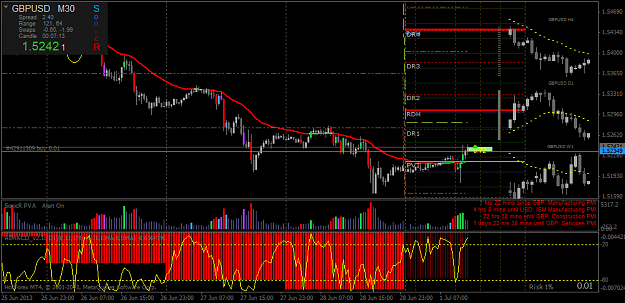
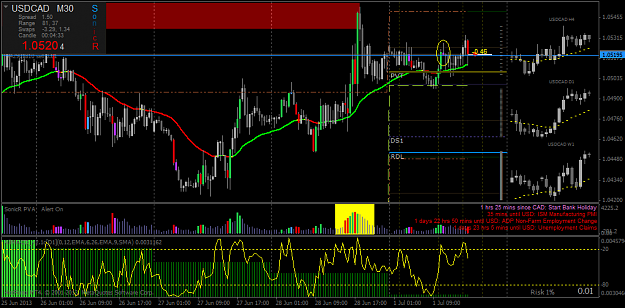
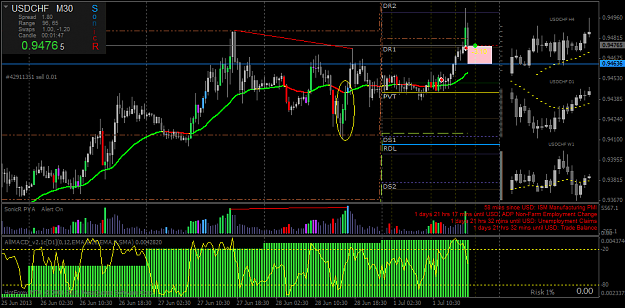
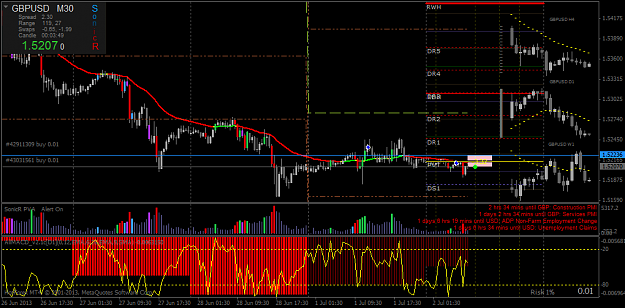
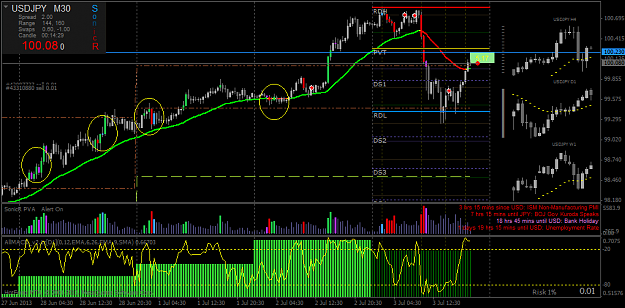
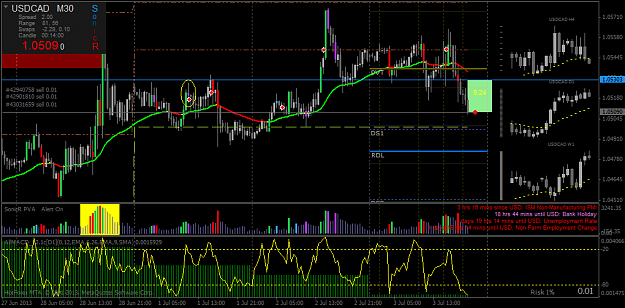
Trend Friendly position building in accordance with PVSRA (Price Volume Support Resistance Analyzing)
Inputs:
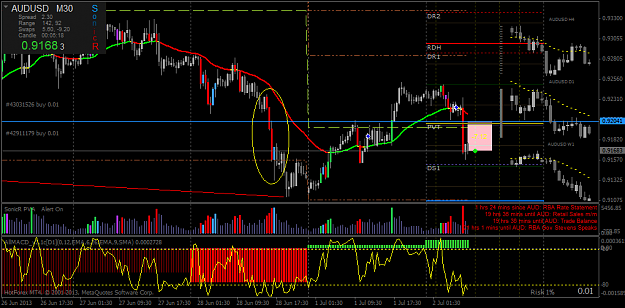
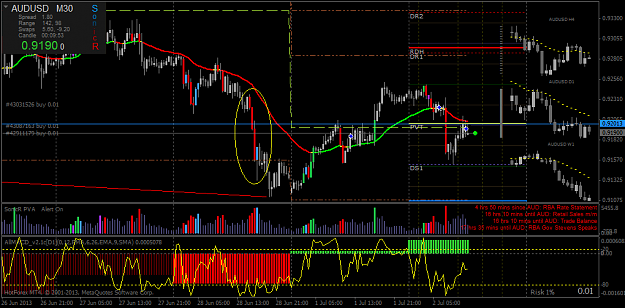
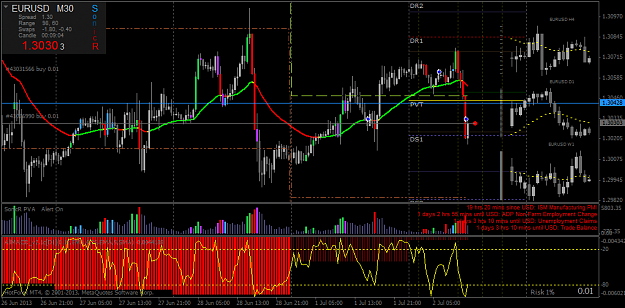
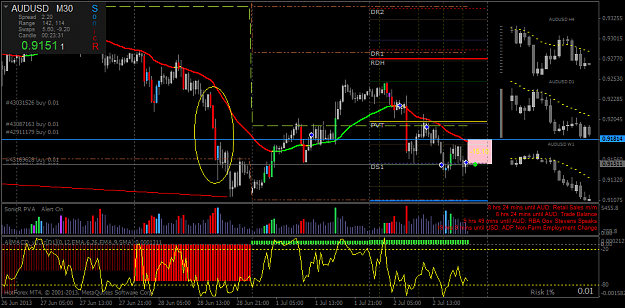
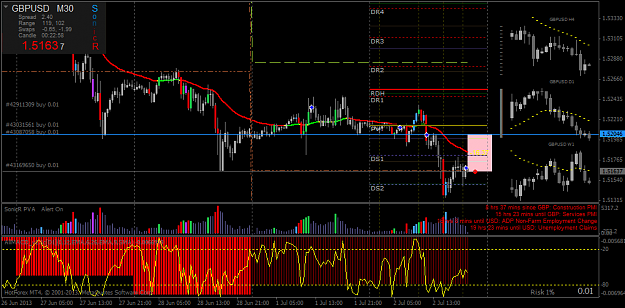
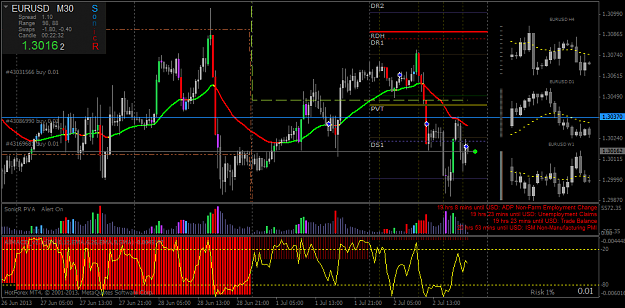
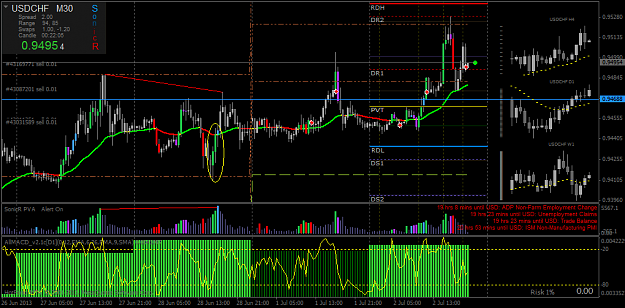
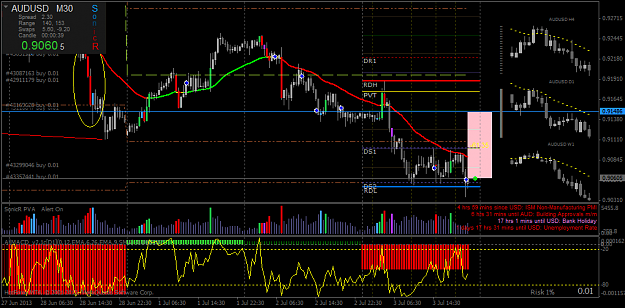
1-Analyzing pairs: EURUSD, GBPUSD, AUDUSD, USDJPY, USDCHF.
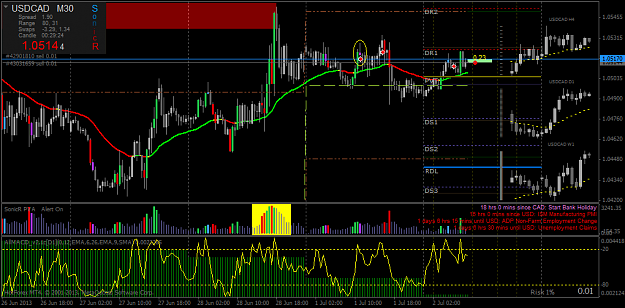
СAD has less volatility so not so interesting.
NZD mostly very correlated with AUD but has bigger spread, so no reason spent time on it.
Very often crosses have more opportunities. For example: if AUDUSD going to LONG but EURUSD to SHORT, then EURAUD has much more opportunities to go SHORT.
Or, if USDJPY is going UP and GBPUSD is going UP then GBPJPY has bigger potential to go UP.

2-The main Time Frame is m30. All other chart for additional analyzing.
3-Indicators for analyzing: 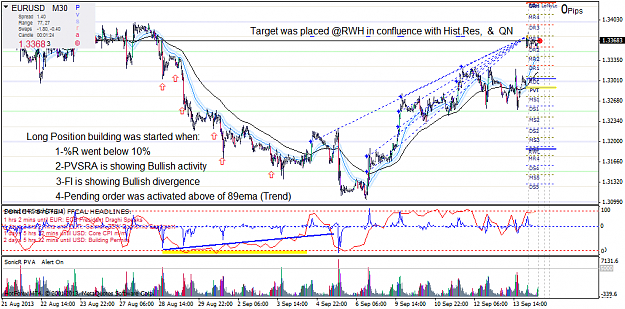
And only couple months ago I have found the solution for myself. The key to success is psychology. 99% of success is psychology. No doubt about it.
The main question of psychology is emotions. Emotions is the main reason of the most mistakes, at least for me.
To be less emotional you have to be less risky. and you need time for thinking.
So, step by step I came to my system. But any way this not proven system yet. That's why I am starting this journal to try to formalize the rules, to collect statistics and to be able to make the work on mistakes.
In fact there is nothing new, everything was invented before - "Trend is your friend", "Buy low - sell high", "Trade what you see" etc....
The main question is interpretation. How to identify the trend? How to understand is it low or is it high? How to trade exactly what you see and how to be sure you see exactly this?
To answer this question we need system, rules, discipline, mental control, patience and experience.
The inspiration to my system I have found from the system of Dr.Alexander Elder - Triple screen.
And from thread of SonicDeejay - Sonic R. system
The essence of system:
To identify trend at Higher time frame (HTF) and to catch pullback at Lower time frame (LTF) to add one m ore very small trade to position.
Sounds like very simple, but reality is not so easy.
Trend Friendly position building in accordance with PVSRA (Price Volume Support Resistance Analyzing)
Inputs:
1-Analyzing pairs: EURUSD, GBPUSD, AUDUSD, USDJPY, USDCHF.
СAD has less volatility so not so interesting.
NZD mostly very correlated with AUD but has bigger spread, so no reason spent time on it.
Very often crosses have more opportunities. For example: if AUDUSD going to LONG but EURUSD to SHORT, then EURAUD has much more opportunities to go SHORT.
Or, if USDJPY is going UP and GBPUSD is going UP then GBPJPY has bigger potential to go UP.
Attached Image
2-The main Time Frame is m30. All other chart for additional analyzing.
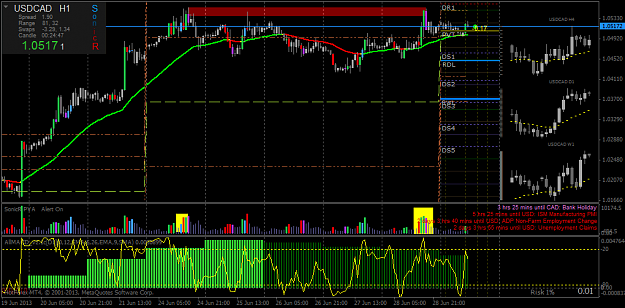
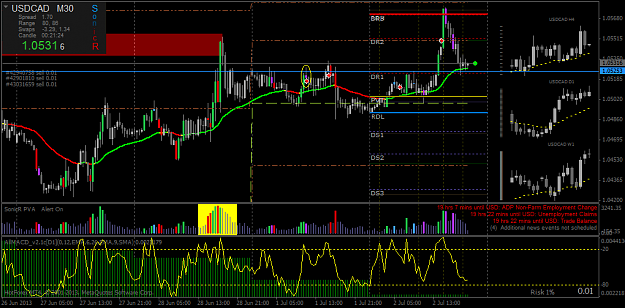
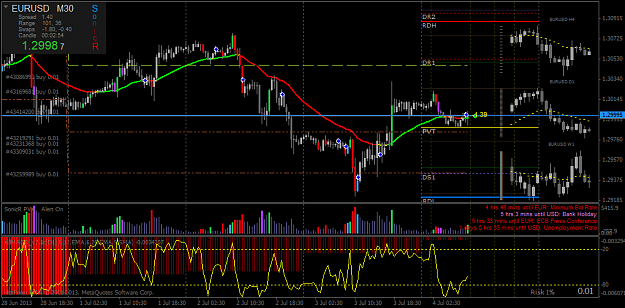
3-Indicators for analyzing:
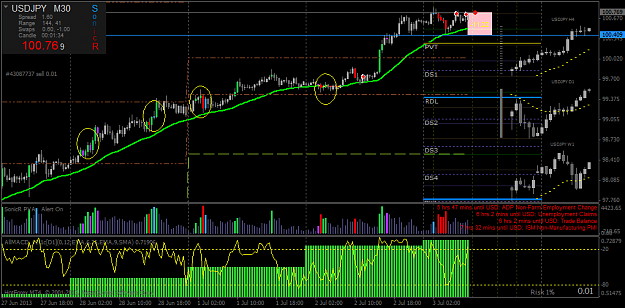
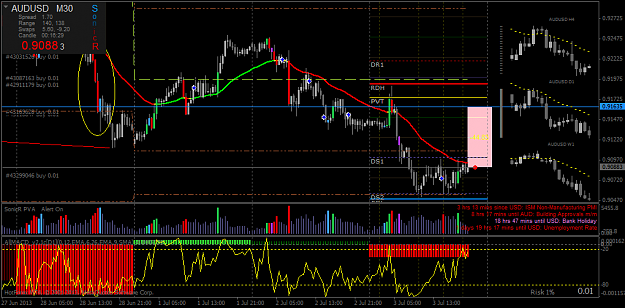
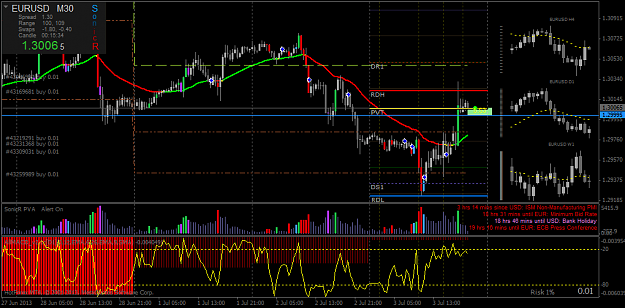
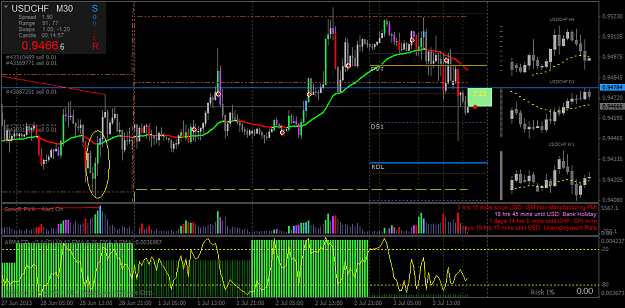
- SonicR template,
- Force Index (FI was created by Dr. Alexander Elder. It is illustrating how strong the actual buying or selling pressure is. The strength of the force is determined by a larger price change or by a larger volume). I am using it at 30M chart.
- Williams %R (%R was developed by Larry Williams. Its purpose is to tell whether a stock or commodity market is trading near the high or the low, or somewhere in between, of its recent trading range.)/ I Am using it at 4hrs chart.
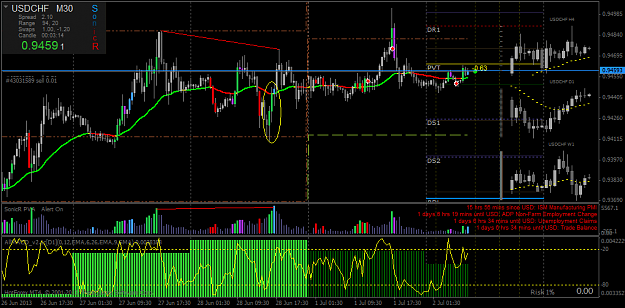
Trading conditions (as example for long position) :
- %R at 4 hrs has to be inside of OS area (under 10%)
- PVSRA showing activities of MM about buying.
- FI is showing the Bullish divergence.
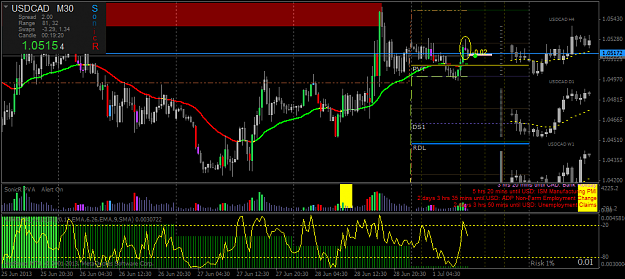
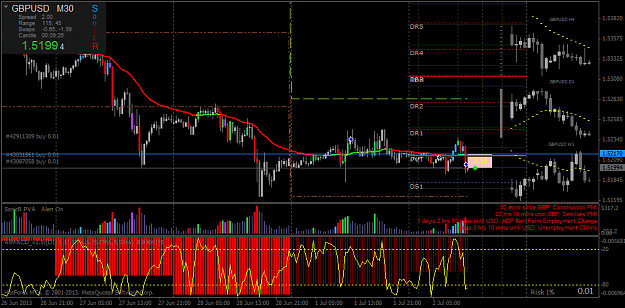
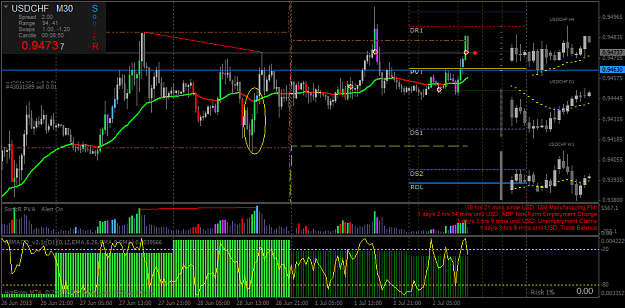
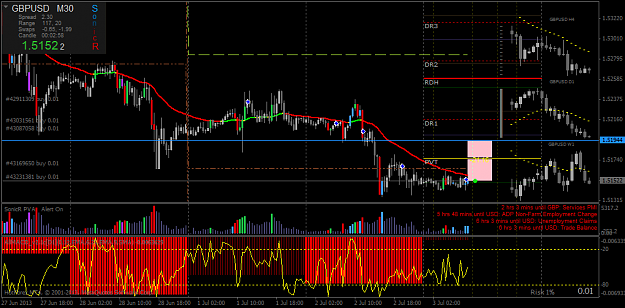
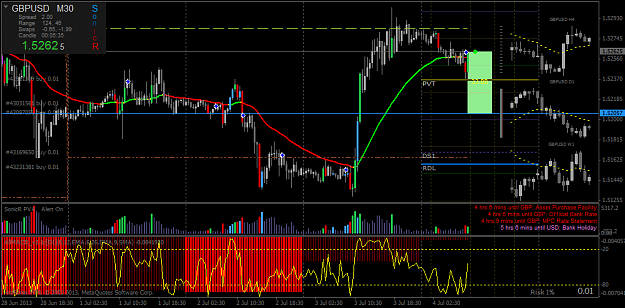
Method of Building:
- Placing of Pending Stop Orders above (for long) "Trend" (EMA89) by levels of RN, HN or QN.
- If too many pending orders they can be changed with only one. For example 10 pending orders by 0.01 lot can be changed with one order equal to 0.1 lot.
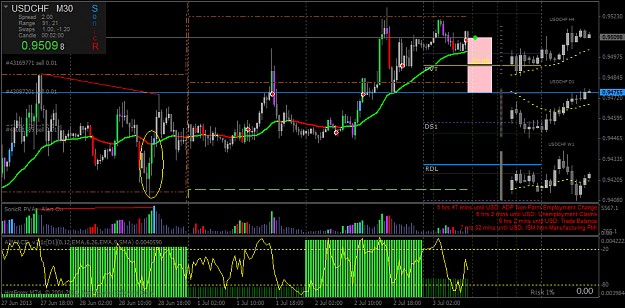
Risk and Money Management:
- For every 1000 of DEPO should be used no more then 0.01 lot per position
- The same time traded no more then 2 not correlated trading pairs, for example EURAUD and GBPJPY
- No more then 20 trades
- All kind of broker bonuses should be refused and leverage no more then 1:100.
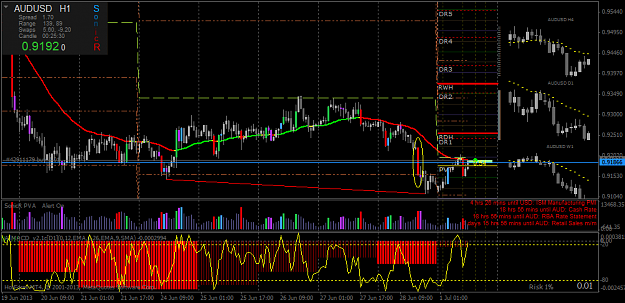
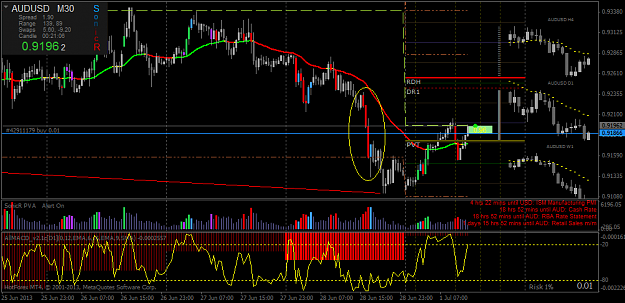
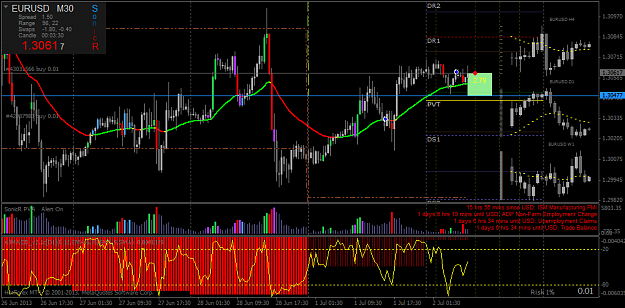
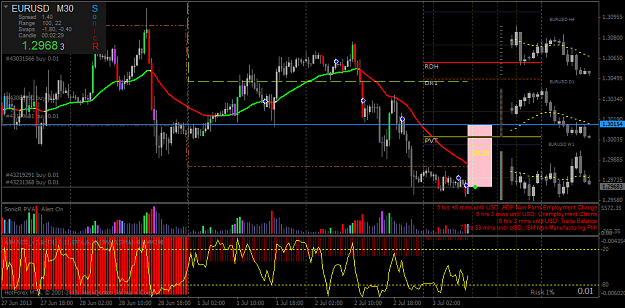
Taking of profit:
- usually very good target is placed around weekly range.
- usually it has much more power if placed in the zone of other levels, like RN, HN, RN or historical S/R.
- don't have to be very fast if there is no any significant signs about trend reversal.
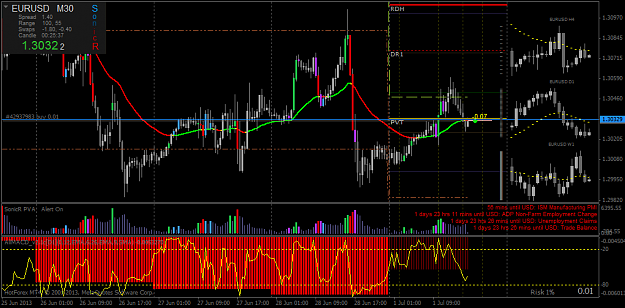
Attached Image
Everything is possible!!! Step by Step...