Hi all coders/programmers,
I need help building a very simple indicator.
Anyone's time in this would be really appreciated.
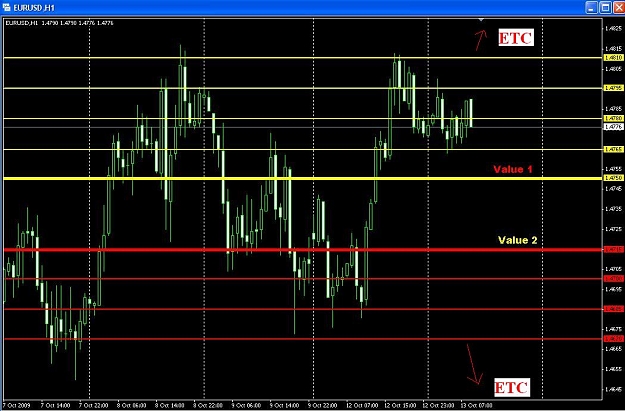
I'm looking for an indicator that can help me draw horizontal lines ever xxx pips, eg. Start point being 1.4750, then lines being drawn every 15 pips from the start point i.e. 1.4765, 1.4780, 1.4795, etc etc .. (JUST SAVES ME MANUALLY DRAWING 10-15 LINES MANUALLY ALL THE TIME)
Now what i am looking for is the indicator to give me some options for flexibility - So i can choose my own inputs:
Value #1 (eg. 1.4750)
Pip Distance (eg. every 15 pips)
No. of Lines (eg. how many lines of 15 pip intervals you want to draw?)
Line Colour (eg. Red, Blue, etc..)
Line Thickness (no explanation needed here)
Value #2 (eg. 1.4730)
Pip Distance (eg. every -15 pips)
No. of Lines (eg. how many lines of 15 pip intervals you want to draw?)
Line Colour
Line Thickness
The same inidicator has a choice of 2 values ... 1 value to have line drawn every 15 pips heading up the chart, and another value having line drawn every 15 pips heading down the chart (hence -15), or it could also be different pip distance like -10 (again option of having whatever)..
Option of having Colours would be great to differentiate the 2 values, and line thickness, well is not that important.
Also another very important thing in this code should be that this SAME indicator can be loaded on the SAME chart twice or thrice to have various other "values" on 1 chart and have their respected +15 pips (or whatever) drawn onto the chart (with different colours) - to help to see confluence.
And if i remove 1 indicator from that chart, then those lines get removed and dont stay on the chart to manually delete them...
I hope this was a simple explanation.
Can anyone help?? Looks like a relative simple logic to make, but then again im no programmer - please help?
Thank You for your time.
Kind Regards.
I need help building a very simple indicator.
Anyone's time in this would be really appreciated.
I'm looking for an indicator that can help me draw horizontal lines ever xxx pips, eg. Start point being 1.4750, then lines being drawn every 15 pips from the start point i.e. 1.4765, 1.4780, 1.4795, etc etc .. (JUST SAVES ME MANUALLY DRAWING 10-15 LINES MANUALLY ALL THE TIME)
Now what i am looking for is the indicator to give me some options for flexibility - So i can choose my own inputs:
Value #1 (eg. 1.4750)
Pip Distance (eg. every 15 pips)
No. of Lines (eg. how many lines of 15 pip intervals you want to draw?)
Line Colour (eg. Red, Blue, etc..)
Line Thickness (no explanation needed here)
Value #2 (eg. 1.4730)
Pip Distance (eg. every -15 pips)
No. of Lines (eg. how many lines of 15 pip intervals you want to draw?)
Line Colour
Line Thickness
The same inidicator has a choice of 2 values ... 1 value to have line drawn every 15 pips heading up the chart, and another value having line drawn every 15 pips heading down the chart (hence -15), or it could also be different pip distance like -10 (again option of having whatever)..
Option of having Colours would be great to differentiate the 2 values, and line thickness, well is not that important.
Also another very important thing in this code should be that this SAME indicator can be loaded on the SAME chart twice or thrice to have various other "values" on 1 chart and have their respected +15 pips (or whatever) drawn onto the chart (with different colours) - to help to see confluence.
And if i remove 1 indicator from that chart, then those lines get removed and dont stay on the chart to manually delete them...
I hope this was a simple explanation.
Can anyone help?? Looks like a relative simple logic to make, but then again im no programmer - please help?
Thank You for your time.
Kind Regards.