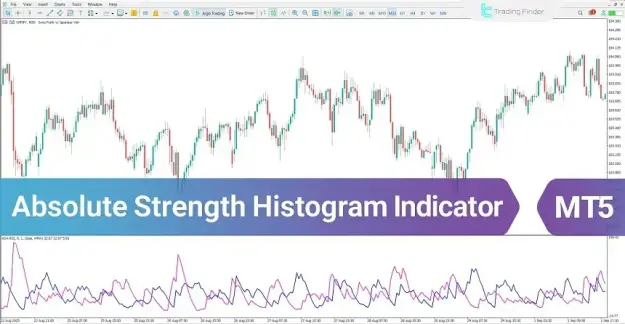
The indicator is displayed as a histogram in a dedicated window, where changes in bar color illustrate the balance of power between buyers and sellers. In addition, crossovers of internal signal lines highlight momentum shifts and signal the potential initiation or conclusion of market trends.
https://cdn.tradingfinder.com/file/5...by-tflab-2.zip
https://www.metalsmine.com/thread/13...or-in-mt4-free
https://www.forexfactory.com/thread/...-in-metatrader
Prop Firm DrawDown Protector : Prop Firm Capital Protection Expert MT5 |Forex Money Management: Forex Trade Management Expert MT5 | ICT Concepts Indicator MT5 |Smart Money Concepts Expert MT5 | Smart Money Trap Scanner | Get a free Expert Advisor license via Telegram and WhatsApp
Indicator Overview and Specifications
The Absolute Strength Histogram Indicator is a well-established tool in technical analysis, offering a structured approach to combining momentum analysis with trend evaluation.
- Categorized as an oscillator within MetaTrader 5
- Effective for analyzing currency strength and market momentum
- Fully integrated with the MetaTrader 5 trading platform
- Suitable for traders with intermediate-level expertise
- Developed to identify potential reversal points
- Compatible with multi-timeframe analysis
- Optimized for intraday trading approaches
- Applicable across various financial instruments:
- Forex currency pairs
- Cryptocurrencies
- Stocks and equities
- Commodities
- Market indices
Absolute Strength Histogram Indicator at a Glance
This indicator determines bullish and bearish market conditions through a combination of trend strength and momentum analysis.
It presents signals using histogram bars and signal lines:
- Blue histogram bars indicate bullish conditions, reflecting dominant buying pressure and a continuation of the upward trend
- Pink histogram bars indicate bearish conditions, representing increased selling pressure and continuation of a downward trend
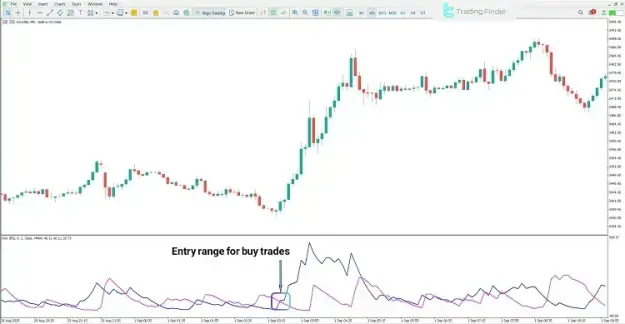
Indicator Performance in Bullish Markets
In bullish environments, the indicator generates multiple confirmations that support long (buy) trading opportunities.
Key Characteristics
- Blue histogram bars signal strong buyer control
- The bullish signal line positioned above the bearish line confirms upward momentum
- Increasing histogram height indicates strengthening demand
Trading Insight
- The alignment of these elements creates favorable conditions for entering buy positions
- Consistent expansion of histogram bars suggests ongoing bullish momentum
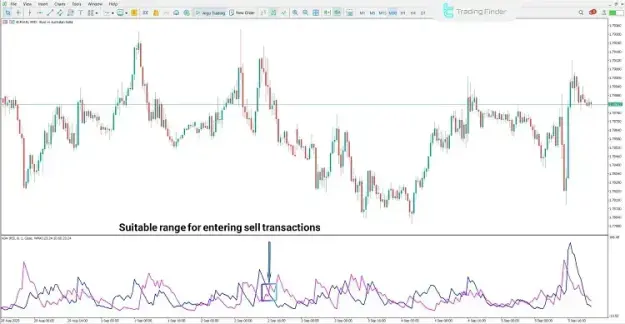
Indicator Performance in Bearish Markets
In bearish conditions, the indicator emphasizes selling pressure and weakening price action.
Key Characteristics
- Histogram bars shift to pink, indicating seller dominance
- Signal line positioning validates bearish momentum
- Expansion of histogram bars reflects strengthening downward pressure
Trading Insight
- These signals highlight potential sell opportunities
- Continued bearish structure suggests persistence of the downtrend
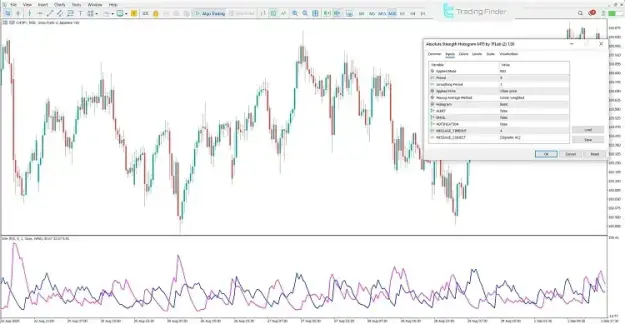
Absolute Strength Histogram Indicator Settings
The indicator includes a flexible configuration panel that allows traders to tailor its behavior according to their strategy.
Core Parameters
- Applied Mode: Defines the calculation method, typically based on the Relative Strength Index (RSI)
- Period: Specifies the number of candles used for calculations
- Smoothing Period: Adjusts the smoothing level of data
- Applied Price: Commonly based on the closing price of each candle
- Moving Average Method: Usually set to Linear Weighted Moving Average (LWMA)
- Histogram Type: Determines the visual format of histogram bars
- Mode_Histo: Controls the histogram display style
Alert and Notification Options
- ALERT: Enables on-screen alerts
- EMAIL: Sends signals via email
- NOTIFICATION: Activates platform push notifications
- MESSAGE_TIMEOUT: Sets the display duration of alerts
- MESSAGE_SUBJECT: Defines the notification title
Conclusion
The Absolute Strength Histogram Indicator is a powerful technical analysis tool that integrates histogram visualization with signal line dynamics to evaluate trend strength and momentum.
By analyzing color transitions and signal crossovers, traders can identify high-probability entry and exit zones. Its adaptability across multiple timeframes and asset classes makes it a valuable addition to advanced trading strategies.