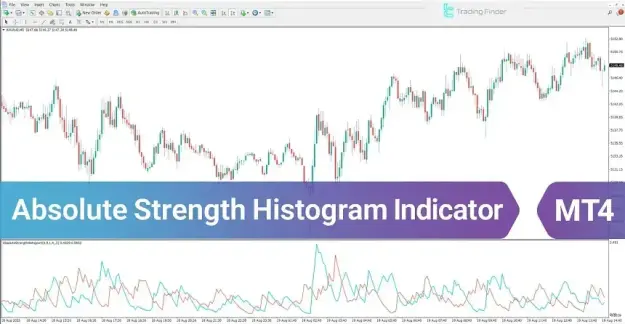
The indicator is displayed in a separate window as a histogram, where color changes and signal line behavior provide a clear and structured view of market sentiment. This allows traders to quickly recognize shifts in momentum and potential trend developments.
 You can download it from this link:
https://cdn.tradingfinder.com/file/5...4-by-tflab.zip
 For instructions on how to install:
https://www.forexfactory.com/thread/...-in-metatrader
Prop Firm DrawDown Protector : Prop Firm Capital Protection Expert MT4 | Forex Money Management: Forex Trade Management Expert MT4 |ICT Concepts Indicator MT4 | Smart Money Concepts Expert MT4| Smart Money Trap Scanner | Get a free Expert Advisor license via Telegram and WhatsApp
Absolute Strength Histogram Indicator Overview
The ASH indicator combines histogram bars with dual signal lines to represent the strength of bullish and bearish market forces.
- Green histogram bars indicate strong buying pressure. In this case, the bullish signal line is positioned above the bearish line, confirming continuation of an uptrend.
- Red histogram bars represent strong selling pressure. Here, the bearish signal line is above the bullish line, confirming continuation of a downtrend.
- Signal line crossovers provide early warnings of potential trend reversals or momentum shifts, offering useful entry and exit signals.
Indicator Characteristics
The Absolute Strength Histogram is a multi-purpose technical indicator with the following key features:
- Momentum-based oscillator derived from price movement
- Suitable for multiple timeframes
- Effective for intraday and short-term trading strategies
- Applicable across various financial markets:
- Forex
- Cryptocurrencies
- Stocks and equities
- Indices
- Commodities
Bullish Trend Analysis
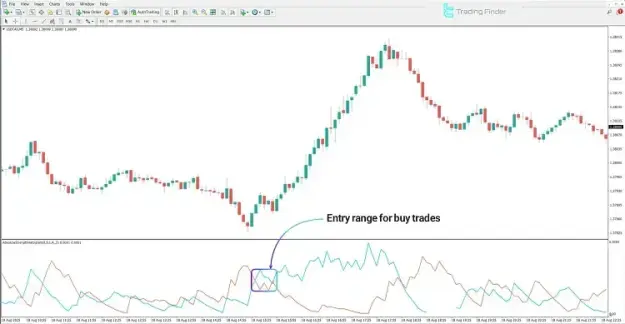
During bullish market conditions, the ASH indicator confirms strong upward momentum and trend continuation.
- Histogram bars turn green, indicating increasing buyer strength
- The bullish signal line crosses above the bearish signal line
- Rising histogram bars reflect growing bullish momentum
Under these conditions, traders may identify high-probability buy opportunities, especially when price action aligns with strengthening momentum signals.
Bearish Trend Analysis
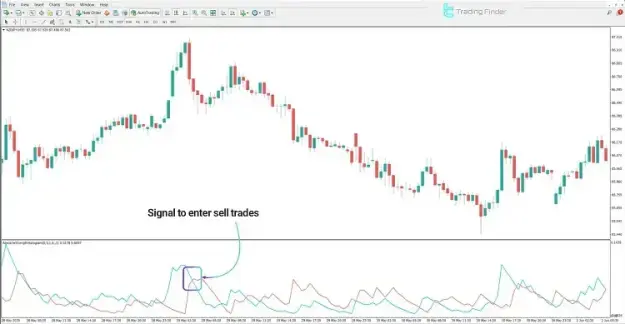
In bearish market conditions, the ASH indicator highlights strong selling pressure and downward trend continuation.
- Histogram bars turn red, indicating increasing seller dominance
- The bearish signal line moves above the bullish signal line
- Increasing histogram height reflects strong bearish momentum
These signals help traders identify potential sell opportunities, particularly when sustained downward pressure is confirmed.
Absolute Strength Histogram Settings
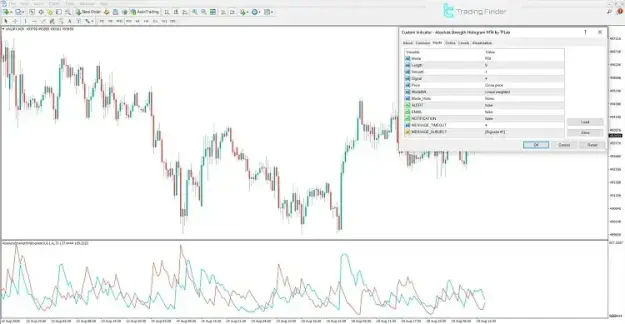
The ASH indicator includes multiple customizable parameters to adapt to different trading styles and market environments:
- Mode: Defines calculation method (e.g., RSI-based logic)
- Length: Sets the main calculation period
- Smooth: Controls data smoothing intensity
- Signal: Defines signal line period
- Price: Selects applied price type (close, open, etc.)
- ModeMA: Determines moving average type
- Mode_Histo: Configures histogram display style
- ALERT: Enables real-time alert notifications
- EMAIL: Activates email-based alerts
- NOTIFICATION: Sends platform push notifications
- MESSAGE_TIMEOUT: Sets alert display duration
- MESSAGE_SUBJECT: Customizes alert message content
Conclusion
The Absolute Strength Histogram (ASH) is a powerful analytical tool for evaluating market trend direction, momentum strength, and price pressure dynamics. By combining color-coded histogram visualization with signal line crossovers, it provides traders with reliable insights for identifying trading opportunities.
Its flexibility across different markets and timeframes makes it a valuable component in technical analysis systems focused on improving decision-making and timing precision.