In addition to signal detection, the indicator forms a dynamic price channel using two colored boundary lines. This channel structure provides a clear visual framework, enabling traders to better interpret price action and make well-informed trading decisions.
https://cdn.tradingfinder.com/file/5...5-by-tflab.zip
https://www.metalsmine.com/thread/13...der-4freetflab
https://www.forexfactory.com/thread/...-in-metatrader
Prop Firm DrawDown Protector : Prop Firm Capital Protection Expert MT5 |Forex Money Management: Forex Trade Management Expert MT5 | ICT Concepts Indicator MT5 |Smart Money Concepts Expert MT5 | Smart Money Trap Scanner | Get a free Expert Advisor license via Telegram and WhatsApp
Key Features of the Super Signal Channel Indicator
Indicator Classification
- Signal & Forecast Indicator
- Bands & Channels Indicator
- Levels Indicator
Platform Compatibility
- MetaTrader 5 (MT5)
Skill Requirement
- Designed for beginner-level traders
Indicator Type
- Reversal Indicator
Timeframe Support
- Multi-timeframe operation
Trading Styles
- Swing Trading
- Scalping
- Day Trading
Supported Markets
- Forex
- Cryptocurrency
- Stocks
Indicator Functionality Overview
The Super Signal Channel Indicator simplifies technical analysis by offering clear visual signals for potential trading opportunities:
- Green arrows represent possible buy entries
- Red arrows indicate potential sell signals
- Dynamic channel lines (green and red) define price boundaries and highlight market volatility
These features assist traders in understanding market direction with improved clarity and efficiency.
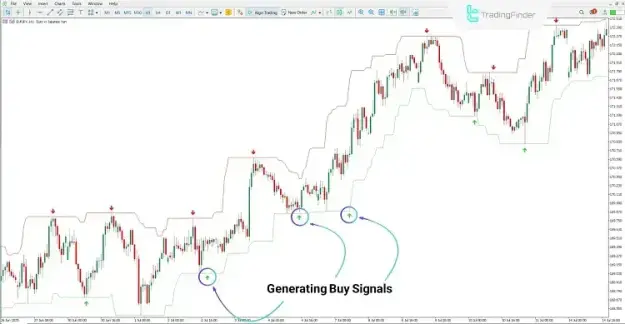
Buy Signal Strategy
Identifying Bullish Opportunities
For example, on the EUR/JPY pair within the 1-hour timeframe, green arrows appear as indicators of potential buying conditions.
- Enter buy trades in alignment with the current trend
- Position stop-loss orders below the lower channel boundary (green line)
- Confirm signals using complementary technical analysis tools
Uptrend Analysis
The indicator supports the identification of sustained upward trends by maintaining price action within the channel limits, helping traders locate favorable entry points.
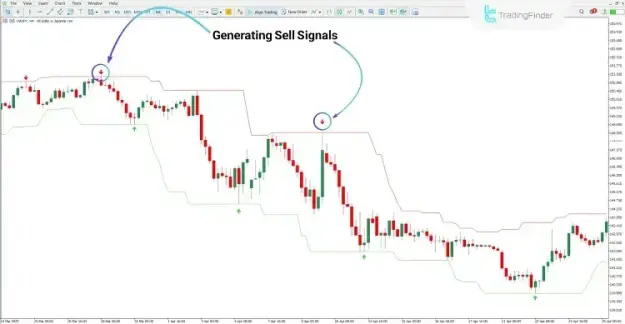
Sell Signal Strategy
Identifying Bearish Opportunities
In scenarios such as the USD/JPY pair on the 4-hour timeframe, red arrows signal potential selling opportunities.
- Initiate sell positions after confirming a downward trend
- Place stop-loss levels above the upper channel boundary
- Monitor price behavior relative to the channel to validate trend continuation
Downtrend Analysis
The indicator enhances bearish market evaluation by highlighting reversal areas and continuation patterns during declining price movements.
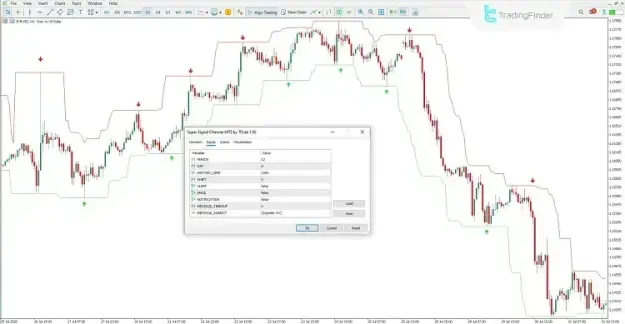
Indicator Settings and Configuration
The Super Signal Channel Indicator includes several adjustable parameters to optimize its performance:
- PERIOD: Specifies the number of calculation periods
- GAP: Determines the distance between price and channel lines
- HISTORY_LIMIT: Defines the number of historical candles analyzed
- SHIFT: Adjusts the horizontal positioning of signals
- ALERT: Enables or disables alert notifications
- EMAIL: Activates email alerts
- NOTIFICATION: Controls push notification alerts
- MESSAGE_TIMEOUT: Sets the time interval between alerts
- MESSAGE_SUBJECT: Defines the alert title
Conclusion
The Super Signal Channel Indicator is a practical and efficient tool for identifying market reversals and improving trade entry and exit strategies. By combining visual signal indicators with adaptive channel boundaries, it offers a structured method for analyzing price movements.
For better trading results, it is advisable to use this indicator alongside other technical analysis techniques, enhancing overall accuracy and consistency in trading performance.