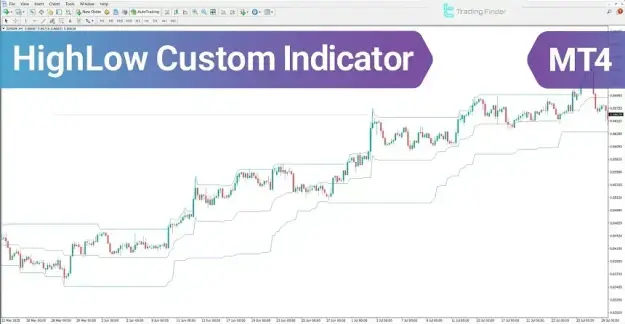
HighLow Custom Indicator Overview
The HighLow Custom Indicator is recognized as a practical solution for detecting dynamic support and resistance levels across a wide range of financial markets. It is fully integrated with the MetaTrader 4 platform and is appropriate for traders with basic to intermediate trading knowledge.
https://cdn.tradingfinder.com/file/5...4-by-tflab.zip
https://www.metalsmine.com/thread/13...-for-mt-5-free
https://www.forexfactory.com/thread/...-in-metatrader
Prop Firm DrawDown Protector : Prop Firm Capital Protection Expert MT4 | Forex Money Management: Forex Trade Management Expert MT4 |ICT Concepts Indicator MT4 | Smart Money Concepts Expert MT4| Smart Money Trap Scanner | Get a free Expert Advisor license via Telegram and WhatsApp
Key Features
- Identified as a support and resistance analysis tool
- Serves as a trading support indicator
- Utilizes band and channel structures for price evaluation
- Enables multi-timeframe analysis
- Suitable for intraday trading approaches
- Applicable across various markets, including:
- Forex
- Cryptocurrency markets
- Equities and stock markets
- Capable of identifying both breakout setups and reversal signals
Structure of the HighLow Custom Indicator
The HighLow Custom Indicator consists of three fundamental bands, each designed to interpret different aspects of price action:
Upper Band
- Links recent swing highs in the market
- Operates as a dynamic resistance zone
- Reveals areas of intensified selling pressure
- Indicates potential price rejection zones near market tops
Lower Band
- Connects recent swing lows
- Functions as a dynamic support zone
- Reflects strong buying interest and demand
- Highlights potential regions for upward price reversals
Middle Band
- Calculated as the average of highs and lows
- Represents the market’s equilibrium level
- Acts as a benchmark for confirming trend direction
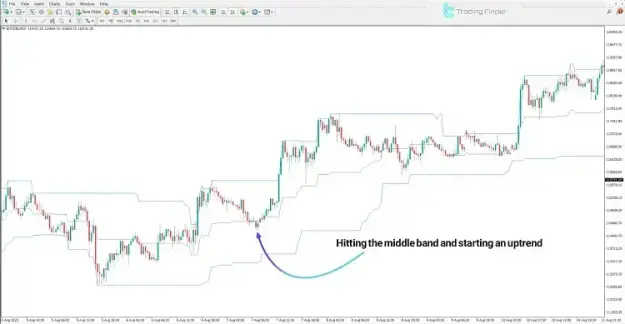
Indicator Behavior in an Uptrend
In bullish conditions, the HighLow Custom Indicator assists in identifying optimal entry zones for buy positions:
- Price typically responds positively when approaching the lower band
- Sustained movement above the middle band confirms buyer strength
- The lower band serves as a support level for trend continuation
- These combined signals suggest favorable conditions for long trades
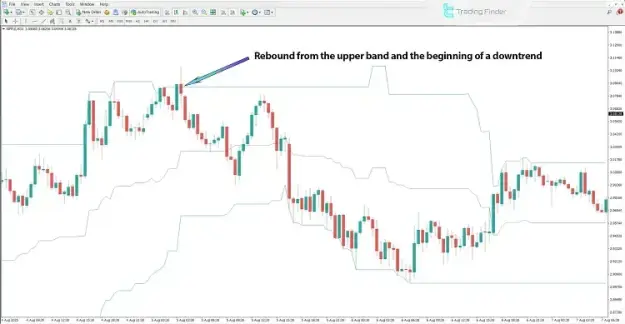
Indicator Behavior in a Downtrend
In bearish scenarios, the indicator provides clear signals for potential selling opportunities:
- Price interaction with the upper band often leads to selling pressure
- The upper band acts as a resistance barrier
- A breakdown below the middle band confirms the dominance of sellers
- Continued price stability below the middle band indicates ongoing downward momentum
- These signals define suitable entry points for sell positions
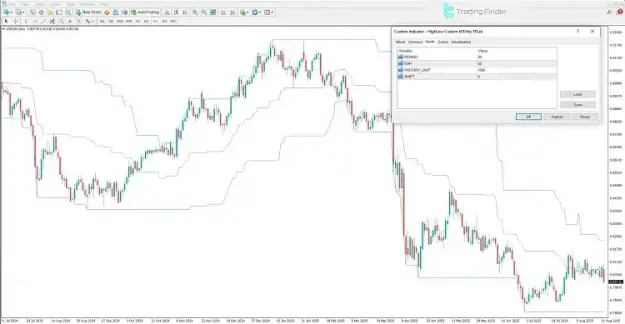
HighLow Custom Indicator Settings
The settings section of the HighLow Custom Indicator in MetaTrader 4 includes several customizable parameters:
- PERIOD
- Specifies the calculation period for evaluating highs and lows
- GAP
- Controls the spacing between the bands to adjust sensitivity
- HISTORY_LIMIT
- Determines the number of past candles included in the analysis
- SHIFT
- Adjusts the horizontal positioning of the indicator
Conclusion
The HighLow Custom Indicator is a reliable and structured tool in technical analysis, developed to identify dynamic support and resistance levels and analyze price movements effectively. By systematically connecting recent highs and lows, it provides traders with a clear perspective on market structure.
Its ability to detect reversal points, validate trend direction, and highlight breakout opportunities makes it an essential component in trading strategies across Forex, cryptocurrency, and stock markets.