By incorporating three specialized analytical bands, this indicator enhances trend analysis and offers a more accurate understanding of overall market dynamics.
https://cdn.tradingfinder.com/file/5...5-by-tflab.zip
https://www.metalsmine.com/thread/13...mt4-free-tflab
https://www.forexfactory.com/thread/...-in-metatrader
Prop Firm DrawDown Protector : Prop Firm Capital Protection Expert MT5 |Forex Money Management: Forex Trade Management Expert MT5 | ICT Concepts Indicator MT5 |Smart Money Concepts Expert MT5 | Smart Money Trap Scanner | Get a free Expert Advisor license via Telegram and WhatsApp
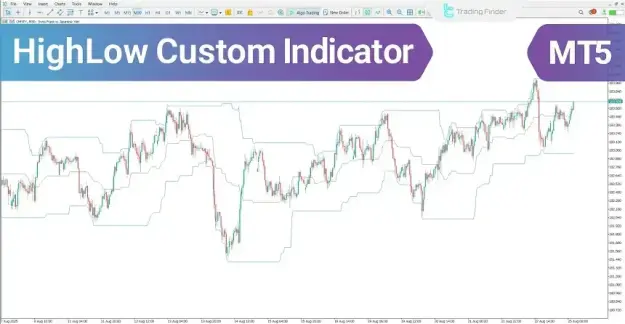
HighLow Custom Indicator Overview
The functionality of the HighLow Custom Indicator is based on three core bands, each serving a distinct purpose in price evaluation:
- Upper Band:
Generated by connecting recent swing highs, this band functions as a dynamic resistance level and reflects selling pressure in higher price areas. - Lower Band:
Formed by linking recent swing lows, this band acts as dynamic support and identifies zones where buying demand may increase. - Middle Band:
Calculated as the midpoint between recent highs and lows, this band represents the market’s equilibrium and highlights the balance between buyers and sellers.
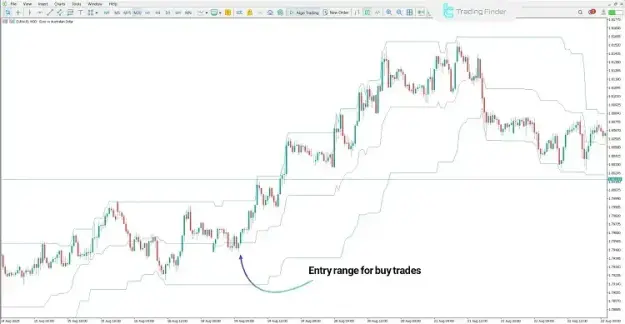
Indicator Analysis in an Uptrend
In bullish conditions, the indicator provides clear signals regarding market strength:
- Price rebounds from the lower band, indicating strong demand.
- Continued movement above the middle band confirms increasing bullish momentum.
- This pattern often signals the emergence of a new upward trend.
- The area near the lower band can be considered a favorable entry zone for buy positions.
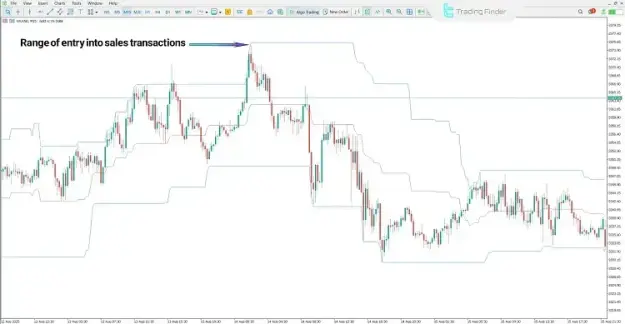
Indicator Analysis in a Downtrend
In bearish markets, the indicator assists in identifying selling setups:
- The upper band serves as a resistance level when price approaches it.
- Rejection from this band increases selling pressure.
- Price stability below the middle band confirms bearish dominance.
- These signals support the continuation of the downtrend and highlight potential sell entry zones.
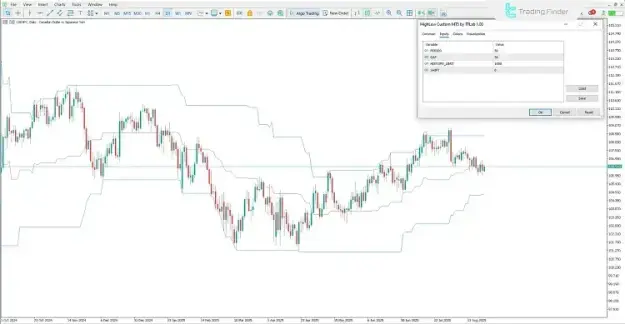
HighLow Custom Indicator Settings
This indicator includes several adjustable parameters to enhance flexibility across different trading strategies:
- PERIOD:
Determines the lookback period for calculating highs and lows. - GAP:
Defines the distance between the bands and adjusts indicator sensitivity. - HISTORY_LIMIT:
Sets the number of historical candles used for calculations. - SHIFT:
Controls the horizontal offset of the indicator on the chart.
Key Features and Applications
- Identification of dynamic support and resistance levels
- Detection of trend reversals and breakout signals
- Suitable for multi-timeframe analysis
- Applicable across various financial markets:
- Forex
- Cryptocurrencies
- Stocks
- Effective for intraday trading approaches
- Strengthens price action analysis through structured band visualization
Conclusion
The HighLow Custom Indicator is a reliable and efficient tool for interpreting market trends using price highs and lows. By plotting dynamic support and resistance levels, it enables traders to assess trend direction, anticipate reversals, and confirm breakout movements with greater accuracy.
Its three-band structure delivers a clear and systematic framework for analyzing price action, making it a valuable resource for both beginner and professional traders.