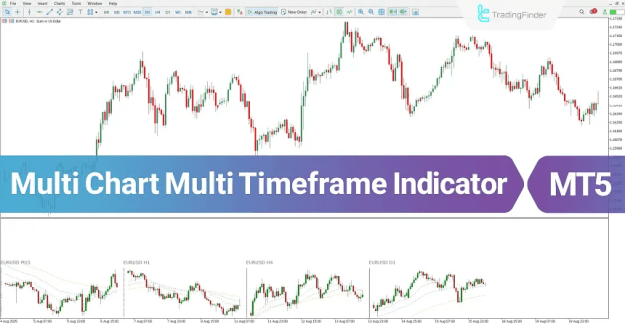
By displaying mini price charts, moving averages, and key analytical filters in a dedicated panel, this indicator enables traders to examine both higher-timeframe market structure and lower-timeframe price dynamics without the need to switch between charts manually.
https://cdn.tradingfinder.com/file/6...5-by-tflab.zip
https://www.metalsmine.com/thread/13...tatrader-4-mt4
https://www.forexfactory.com/thread/...-in-metatrader
Prop Firm DrawDown Protector : Prop Firm Capital Protection Expert MT5 |Forex Money Management: Forex Trade Management Expert MT5 | ICT Concepts Indicator MT5 |Smart Money Concepts Expert MT5 | Smart Money Trap Scanner | Get a free Expert Advisor license via Telegram and WhatsApp
Multi Chart Multi Timeframe Indicator Overview
The Multi Timeframe Multi Chart Indicator enhances analytical precision by aligning price action across several timeframes. This multi-layered approach strengthens trend validation and helps traders identify trend reversals, consolidation zones, and corrective movements at an earlier stage.
Key advantages include:
- Simultaneous visualization of multiple timeframes
- Clear identification of trend alignment and divergence
- Reduced chart clutter and improved analytical efficiency
- Effective application in both trend-following and reversal strategies
Indicator Categories and Trading Compatibility
Indicator Classification
- Trading Assist MT5 Indicators
- Moving Average MT5 Indicators
Supported Platform
- MetaTrader 5 (MT5)
Trading Skill Requirement
- Intermediate
Indicator Features
- Non-Repaint MT5 Indicator
- Reversal Detection Capability
Timeframe Coverage
- Multi-Timeframe Analysis
Supported Trading Styles
- Scalping
- Day Trading
- Swing Trading
Applicable Markets
- Forex
- Cryptocurrencies
- Stocks and Shares
- Commodities
- Indices
How the Multi Chart Multi Timeframe Indicator Functions
This indicator is designed to detect bullish and bearish market trends by evaluating price behavior across several selected timeframes.
When price movement is consistently aligned between lower and higher timeframes, the probability of a strong and sustainable trend increases. In contrast,
conflicting signals across timeframes may suggest:
- Trend exhaustion
- Market consolidation
- Potential reversal zones
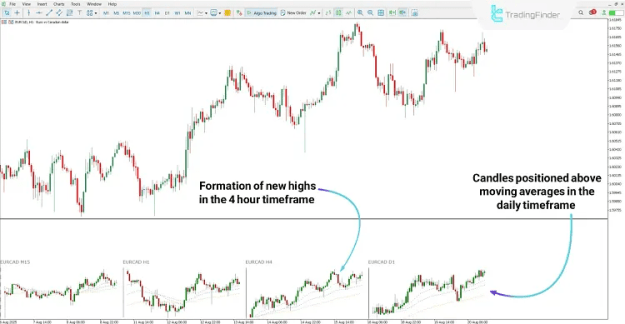
Bullish Trend Identification
A bullish market condition is confirmed when price action remains above short-term, mid-term, and long-term moving averages across all configured timeframes.
Under these circumstances:
- Higher highs and higher lows are preserved
- Trend continuation probability increases
- Long trade setups become more reliable
This alignment reflects strong buying pressure and sustained upward momentum.
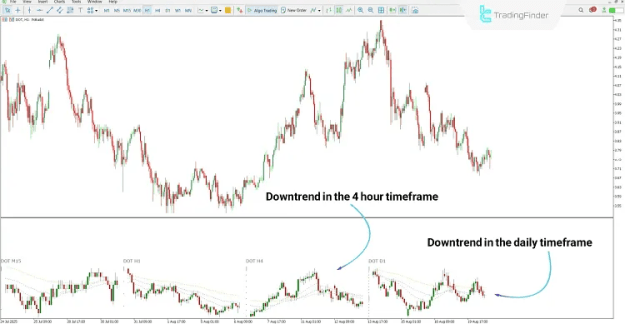
Bearish Trend Identification
A bearish trend is identified when price action remains below the moving averages across both higher and lower timeframes.
In such conditions:
- Lower highs and lower lows dominate
- Selling pressure exceeds buying demand
- Short trade opportunities gain higher probability
This setup is particularly effective for identifying extended downtrends in volatile markets, including cryptocurrencies.
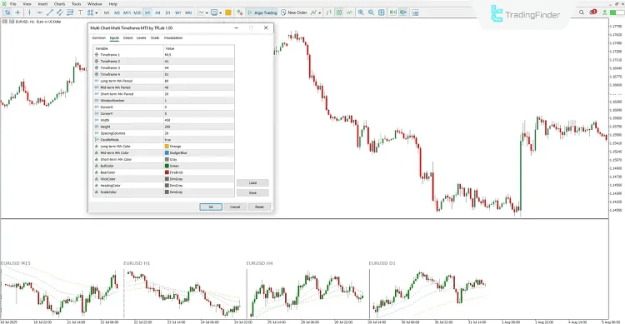
Multi Chart Multi Timeframe Indicator Settings
The indicator offers extensive customization options, allowing traders to adapt both its analytical behavior and visual layout to their preferred trading strategy.
Timeframe Configuration
- Timeframe 1: Primary analysis timeframe
- Timeframe 2: Secondary confirmation timeframe
- Timeframe 3: Additional validation timeframe
- Timeframe 4: Higher-timeframe market overview
Moving Average Parameters
- Long-term moving average period
- Mid-term moving average period
- Short-term moving average period
Display and Layout Options
- Indicator window number selection
- Horizontal and vertical positioning
- Adjustable width and height
- Spacing between mini chart columns
- Candlestick display mode
Color Customization
- Long-term moving average color
- Mid-term moving average color
- Short-term moving average color
- Bullish candle color
- Bearish candle color
- Wick color
- Timeframe label color
- Axis and scale color
Note:
To ensure proper functionality, the required font must be installed before using the indicator. The font file is included in the installation package.
Conclusion
The Multi Chart Multi Timeframe Indicator for MT5 delivers a powerful and streamlined solution for traders who require clear multi-timeframe market insight without sacrificing chart clarity.
By combining synchronized chart views with short-term, mid-term, and long-term moving averages, this indicator improves trend analysis accuracy and supports more confident trading decisions across a wide range of markets and trading styles.
This tool is especially valuable for traders seeking a structured, disciplined, and professional approach to trend confirmation and overall market context evaluation.