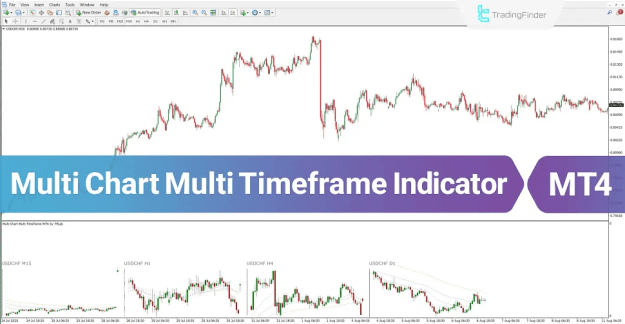
By displaying price action, moving averages, and technical data for several timeframes within a single, separate panel, this indicator eliminates the need to constantly switch charts. As a result, traders can gain a broader market perspective while maintaining execution accuracy.
https://cdn.tradingfinder.com/file/5...4-by-tflab.zip
https://www.metalsmine.com/thread/13...load-freetflab
https://www.forexfactory.com/thread/...-in-metatrader
Prop Firm DrawDown Protector : Prop Firm Capital Protection Expert MT4 | Forex Money Management: Forex Trade Management Expert MT4 |ICT Concepts Indicator MT4 | Smart Money Concepts Expert MT4| Smart Money Trap Scanner | Get a free Expert Advisor license via Telegram and WhatsApp
Specifications of the Multi Chart Multi Timeframe Indicator
The Multi Timeframe Multi Chart indicator for MetaTrader 4 is categorized as follows:
- Indicator Categories
- Trading Assist MT4 Indicators
- Moving Average MT4 Indicators
- Platform Compatibility
- MetaTrader 4
- Trading Skill Level
- Intermediate
- Indicator Types
- Reversal MT4 Indicators
- Non-Repainting MT4 Indicators
- Timeframe Support
- Multi-Timeframe MT4 Indicators
- Supported Trading Styles
- Day Trading
- Scalping
- Swing Trading
- Applicable Trading Instruments
- Forex
- Cryptocurrencies
- Stock Market
- Indices
- Commodities
- Share Stocks
Multi Chart Multi Timeframe Indicator Overview
The primary function of the Multi Chart Multi Timeframe indicator is to analyze bullish and bearish market trends across different time horizons.
Key analytical principles include:
- Alignment between short-term and long-term timeframes signals strong trend continuation
- Conflicting signals between timeframes indicate trend weakness, potential reversal, or a corrective/neutral market phase
This multi-layered view allows traders to assess trend strength with higher confidence.
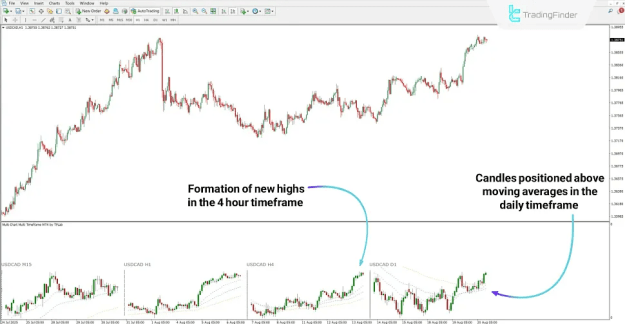
Bullish Trend Detection
Based on the USD/CAD market analysis:
- Price remains above moving averages across all selected timeframes
- Higher highs and higher lows are consistently formed
- Trend alignment confirms sustained bullish momentum
Under these conditions, the indicator confirms an uptrend and assists traders in identifying trend continuation zones.
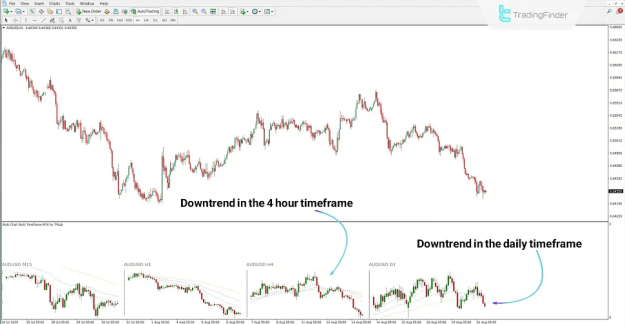
Bearish Trend Detection
According to the AUD/USD chart analysis:
- Price trades below the moving average on daily and 4-hour timeframes
- Downward momentum is confirmed by multi-timeframe alignment
- The indicator highlights increasing bearish pressure
Such alignment suggests trend continuation to the downside and supports short-trade decision-making.
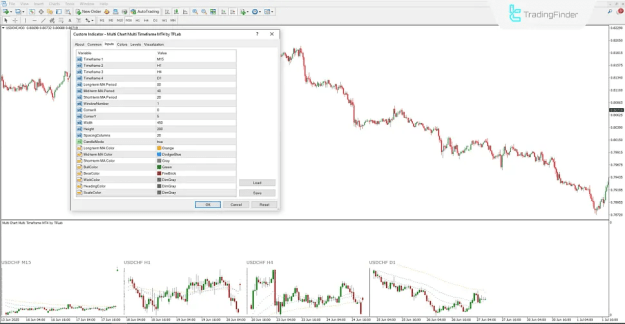
Multi Chart Multi Timeframe Indicator Settings
The indicator offers extensive customization options to adapt to various trading strategies:
Timeframe Configuration
- Timeframe 1: First selected timeframe
- Timeframe 2: Second selected timeframe
- Timeframe 3: Third selected timeframe
- Timeframe 4: Fourth selected timeframe
Moving Average Parameters
- Long-term MA Period: Long-term trend assessment
- Mid-term MA Period: Medium-term trend confirmation
- Short-term MA Period: Short-term price behavior analysis
Display and Layout Settings
- WindowNumber: Indicator display window
- CornerX / CornerY: Horizontal and vertical position
- Width / Height: Indicator panel dimensions
- SpacingColumns: Space between mini-chart columns
Visual Customization
- CandleMode: Candlestick display style
- Long-term MA Color: Long-term moving average color
- Mid-term MA Color: Mid-term moving average color
- Short-term MA Color: Short-term moving average color
- BullColor: Bullish candle color
- BearColor: Bearish candle color
- WickColor: Candle wick color
- HeadingColor: Timeframe label color
- ScaleColor: Axis and scale number color
Note: To ensure proper functionality, the required font must be installed prior to using the indicator. The font file is included in the indicator installation package.
Conclusion
The Multi Chart Multi Timeframe indicator enables traders to monitor multiple charts and timeframes simultaneously within a single interface.
By combining short-term, mid-term, and long-term moving averages, this tool enhances the identification of:
- Overall market trend direction
- Trend strength and consistency
- Potential reversal or correction zones
As a result, it serves as a powerful decision-support tool for traders seeking structured, multi-timeframe market analysis on MetaTrader 4.