https://cdn.tradingfinder.com/file/5...5-by-tflab.zip
https://www.metalsmine.com/thread/13...r-for-mt4-free
https://www.forexfactory.com/thread/...-in-metatrader
Prop Firm DrawDown Protector : Prop Firm Capital Protection Expert MT5 |Forex Money Management: Forex Trade Management Expert MT5 | ICT Concepts Indicator MT5 |Smart Money Concepts Expert MT5 | Smart Money Trap Scanner | Get a free Expert Advisor license via Telegram and WhatsApp
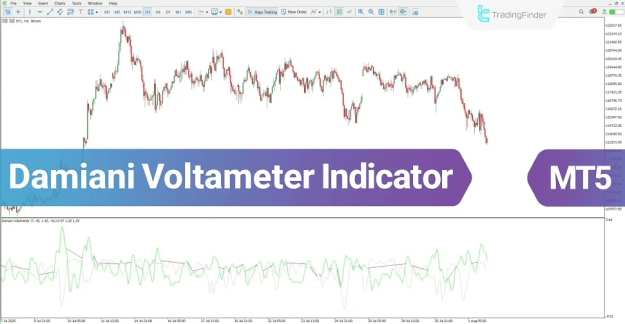
Core Structure and Visual Components
The indicator's visual framework is built upon two distinct curves:
- Green Line (Volatility Line): Represents real and reliable market activity and momentum.
- Gray Line (Noise Line): Signifies market noise and ranging, low-volatility conditions.
The interpretation of market state is derived from the relative positioning of these two lines.
Damiani Voltameter Oscillator: Key Specifications
Indicator Categories:
- MT5 Oscillators
- MT5 Signal & Forecast Indicators
- MT5 Volatility Indicators
Compatible Platforms:
- MetaTrader 5
Recommended Trading Skill Level:
- Intermediate
Indicator Types:
- MT5 Range Indicators
- MT5 Reversal Indicators
Supported Timeframes:
- Multi-Timeframe MT5 Indicators
Suitable Trading Styles:
- MT5 Swing Trading Indicators
- MT5 Scalper Indicators
- MT5 Day Trading Indicators
Applicable Trading Instruments:
- Forex MT5 Indicators
- Crypto MT5 Indicators
- Stock MT5 Indicators
Identifying Market States Through Line Position
The core signal logic of the Damiani Voltameter is straightforward yet powerful:
- Green Line Above Gray Line: This configuration indicates a period of genuine, reliable market activity with sufficient volatility. Such conditions are typically considered favorable for entering trades, as the market is exhibiting clearer directional momentum.
- Gray Line Above Green Line: This signals a low-volatility or ranging market phase. During these periods, price action is often dominated by noise, making sustained trends less likely and generally presenting unfavorable conditions for trade entry.
The Red Boundary Line
The indicator provides an additional visual cue by drawing a distinct horizontal red line. This boundary is activated when the noise line (gray) rises significantly, clearly demarcating a confirmed non-trending or low-volatility zone on the chart.
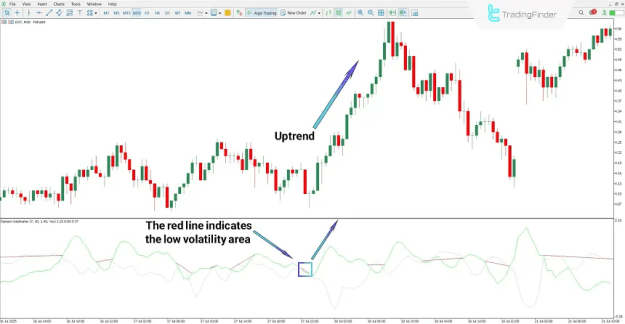
Uptrend Conditions and Identification
Analysis of a Polkadot (DOT) cryptocurrency chart on a 30-minute timeframe demonstrates the indicator's utility. When the gray noise line resides above the green volatility line, the market is identified as being in a ranging, low-volatility state. The concurrent appearance of the red boundary line reinforces this analysis.
The transition to an uptrend is signaled when the green volatility line crosses above the gray noise line. Following this crossover, the chart shows the market entering a clear and sustained upward movement, validating the indicator's condition assessment.
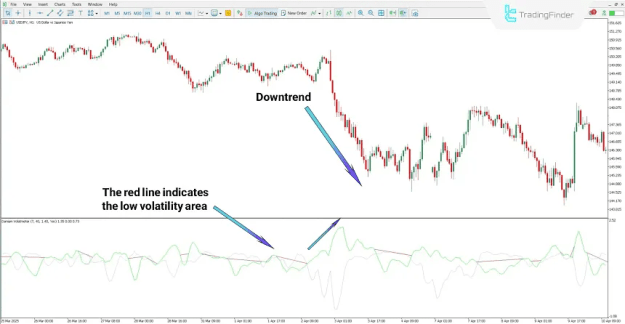
Downtrend Conditions and Identification
On a USD/JPY one-hour chart, the indicator captures the onset of a downtrend. The key event is the volatility line (green) crossing above the noise line (gray). This shift, occurring under bearish market pressure, indicates a break from a prior ranging phase. Subsequently, the price breaks its range to the downside and enters a definitive declining trend, demonstrating the tool's effectiveness in spotting the start of volatile downward moves.
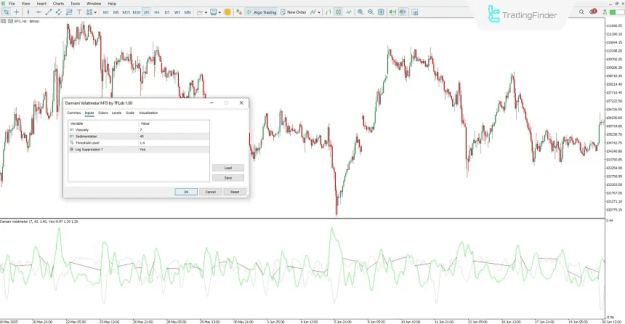
Configuring the Damiani Voltameter Oscillator
The indicator's settings panel allows for customization to align with different trading instruments and styles:
- Viscosity: This parameter defines the number of candles used for calculating market noise. It adjusts the sensitivity of the noise line.
- Sedimentation: This setting controls the period for smoothing price fluctuations. It helps in identifying continuous market behavior by filtering out minor irregularities.
- Threshold Level: A critical value for comparing volatility against noise. It fine-tunes the sensitivity for generating the core signal of favorable trading conditions.
- Lag Suppressor: An optional mechanism that, when activated, aims to reduce delays in the indicator's signal output, providing more timely readings.
Conclusion
The Damiani Voltameter Oscillator is strategically designed to identify and filter out unfavorable, low-volatility market conditions. Its primary value lies not in predicting direction, but in assessing overall market tradability.
By evaluating the presence of sufficient and reliable volatility, it helps traders avoid choppy, sideways markets and focus their attention on periods where the probability of sustained price movement is higher. This makes it an essential analytical filter for swing traders, day traders, and scalpers seeking to align their strategies with the current market environment.