https://cdn.tradingfinder.com/file/5...4-by-tflab.zip
https://www.metalsmine.com/thread/13...tatrader-5-mt5
https://www.forexfactory.com/thread/...-in-metatrader
Prop Firm DrawDown Protector : Prop Firm Capital Protection Expert MT4 | Forex Money Management: Forex Trade Management Expert MT4 |ICT Concepts Indicator MT4 | Smart Money Concepts Expert MT4| Smart Money Trap Scanner | Get a free Expert Advisor license via Telegram and WhatsApp
The Damiani Voltameter oscillator operates through two primary components:
- Green volatility line: Reflects the strength and validity of actual price movement.
- Gray noise line: Represents periods of limited activity, irregular movement, or choppy behavior.
The interaction between these two lines determines whether the market is displaying a legitimate trend or remaining confined within a consolidation phase.
Specifications of the Damiani Voltameter Indicator
The Damiani Voltameter is classified under several MetaTrader 4 indicator categories, including:
- Oscillators MT4 Indicators
- Signal & Forecast MT4 Indicators
- Volatility MT4 Indicators
Platform Compatibility:
- MetaTrader 4 (MT4)
Best Suited For:
- Intermediate-level traders
Indicator Types:
- Range MT4 Indicators
- Reversal MT4 Indicators
Timeframe Support:
- Multi-Timeframe MT4 Indicators
Trading Styles Supported:
- Day Trading
- Scalping
- Swing Trading
Applicable Markets:
- Forex
- Cryptocurrency assets
- Stock market instruments
Damiani Voltameter Indicator at a Glance
The Damiani Voltameter evaluates market conditions by comparing volatility to noise:
- When the green line rises above the gray line, the indicator considers the market active and tradable, reflecting a genuine trend.
- When the gray line moves above the green line, the market is deemed low-volatility or range-bound, signaling conditions that are unfavorable for trend-based trading.
A horizontal red line also appears to highlight areas where volatility is suppressed and price action lacks clear direction.
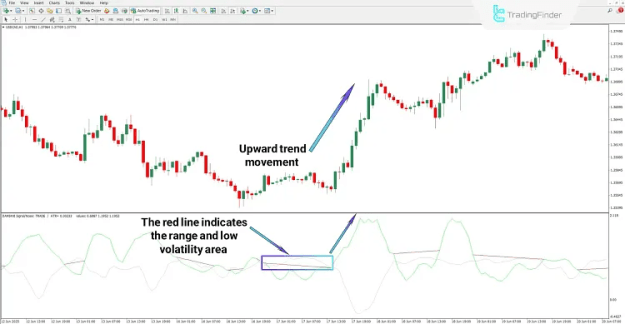
Uptrend Conditions
In the USD/CAD H1 example, the gray line initially sits above the green line, indicating a range-bound market.
Once the green line crosses above the gray line, the Damiani Voltameter confirms increasing volatility, verifying the start of a bullish trend.
- Indication of strengthening upward momentum
- Transition out of a low-volatility environment
- Confirmation of bullish price structure
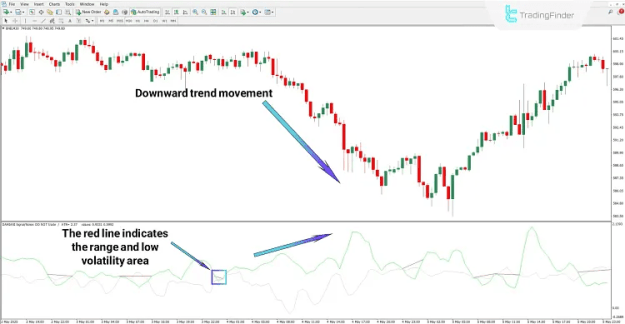
Downtrend Conditions
On the 30-minute chart of Binance Coin (BNB), the volatility line surpasses the noise line, signaling intensified market activity.
As price begins to decline, it breaks below the consolidation area and establishes a confirmed bearish trend.
- Growth in downside volatility
- Breakout from a consolidation phase
- Confirmation of sustained bearish momentum
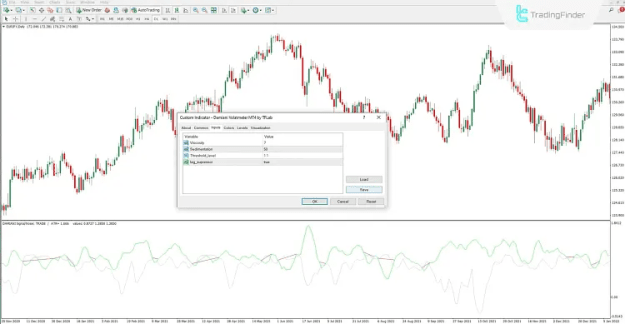
Damiani Voltameter Indicator Settings
The Damiani Voltameter includes several adjustable parameters to optimize performance:
- Viscosity:
Specifies the number of candles used to evaluate market noise. - Sedimentation:
Defines the smoothing period applied to price fluctuations for more stable measurement of volatility. - Threshold_Level:
Sets the minimum threshold required for volatility to exceed noise, allowing precise classification of trending and non-trending conditions. - Lag_Supressor:
Activates an internal mechanism that reduces signal delay and enhances responsiveness to market changes.
Conclusion
The Damiani Voltameter oscillator serves as a highly effective market filter, identifying periods of low volatility and indecision that are typically unsuitable for active trading.
Although it does not generate explicit buy or sell signals, it excels at distinguishing favorable trading environments from unproductive or noisy conditions.
By clearly separating genuine market trends from volatility-deficient phases, the Damiani Voltameter enables traders to make more informed, disciplined, and strategically aligned decisions.