By simultaneously assessing price volatility and market momentum, this oscillator improves the identification of potential reversal zones and enhances the precision of both entry and exit decisions in trading.
https://cdn.tradingfinder.com/file/5...4-by-tflab.zip
https://www.metalsmine.com/thread/13...-download-free
https://www.forexfactory.com/thread/...-in-metatrader
Prop Firm DrawDown Protector : Prop Firm Capital Protection Expert MT4 | Forex Money Management: Forex Trade Management Expert MT4 |ICT Concepts Indicator MT4 | Smart Money Concepts Expert MT4| Smart Money Trap Scanner | Get a free Expert Advisor license via Telegram and WhatsApp
Specifications of the Bollinger Bands and RSI Oscillator
Indicator Categories
- Oscillators MT4 Indicators
- Bands & Channels MT4 Indicators
Supported Platform
- MetaTrader 4 Indicators
Trading Skill Level
- Elementary
Indicator Type
- Reversal MT4 Indicators
Applicable Timeframes
- Multi-Timeframe MT4 Indicators
Trading Styles
- Day Trading MT4 Indicators
- Scalping MT4 Indicators
- Swing Trading MT4 Indicators
Trading Instruments
- Stock Market MT4 Indicators
- Cryptocurrency MT4 Indicators
- Forex MT4 Indicators
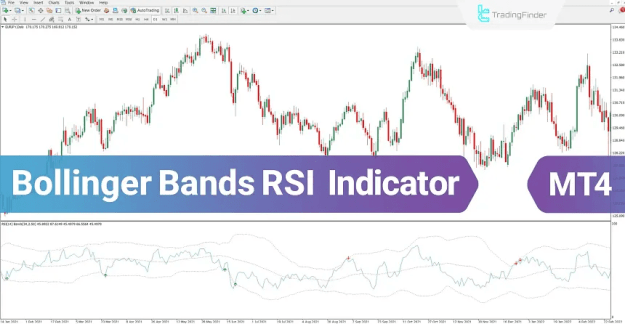
Bollinger Bands and RSI Indicator Overview
The Bollinger Bands and RSI Indicator evaluates the behavior of the RSI line in relation to the Bollinger Bands to determine overbought and oversold market conditions.
- When the RSI line reaches the lower Bollinger Band, the market is classified as oversold, and the indicator generates a buy signal.
- When the RSI line touches the upper Bollinger Band, the market is considered overbought, leading the indicator to issue a sell signal, commonly displayed with a red arrow.
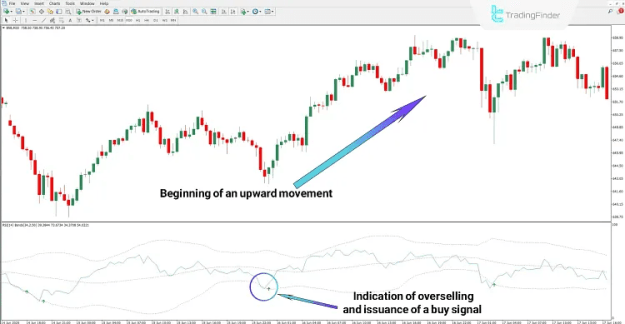
Buy Signal Example
On the Binance Coin (BNB) chart within the 30-minute timeframe, the RSI line touching the lower band signaled oversold conditions.
Shortly afterward, the indicator identified a trend reversal and issued a buy signal at the exact point of contact, marked by a green arrow.
Key Observations
- Confirmation of oversold conditions
- Identification of reversal momentum
- Clear generation of a buy signal
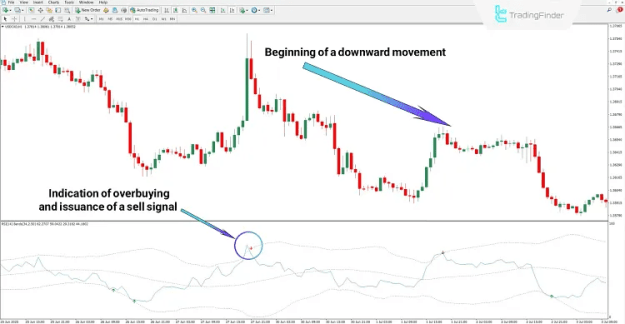
Sell Signal Example
On the USD/CAD chart in the 1-hour timeframe, the RSI line touching the upper band indicated overbought conditions and increased likelihood of a downward reversal.
At this moment, the Bollinger Bands and RSI Indicator issued a sell signal, confirming the onset of bearish movement.
Key Observations
- Detection of overbought conditions
- Formation of a downward reversal
- Accurate confirmation of a sell signal
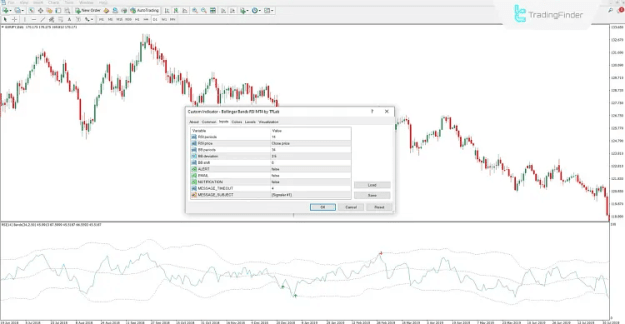
Settings of the Bollinger Bands and RSI Indicator
The indicator includes a range of adjustable parameters, allowing traders to configure the tool according to their preferred trading strategy.
Adjustable Inputs
- RSI Period: Sets the calculation period for the Relative Strength Index
- RSI Price: Specifies the price type used in RSI calculations
- BB Periods: Defines the number of periods applied to Bollinger Bands
- BB Deviation: Determines the standard deviation for the upper and lower bands
- BB Shift: Adjusts the horizontal shift of the Bollinger Bands on the chart
- ALERT: Enables real-time alerts for trade signals
- EMAIL: Sends signal notifications via email
- NOTIFICATION: Activates push notifications on the trading platform
- MESSAGE_TIMEOUT: Sets the display duration for alert pop-up messages
- MESSAGE_SUBJECT: Defines the subject line for alert notifications
Conclusion
The Bollinger Bands and RSI Oscillator is a highly effective combination indicator designed to identify overbought and oversold zones across various financial markets.
By integrating volatility analysis with momentum assessment, the indicator delivers precise buy and sell signals whenever the RSI interacts with the Bollinger Bands.
This makes it a versatile and valuable tool for traders in the cryptocurrency, forex, stock, and commodity markets.