By unifying volatility assessment with momentum evaluation, this oscillator assists traders in identifying probable price reversal zones and improving the precision of trade entries and exits across a wide range of financial markets.
https://cdn.tradingfinder.com/file/5...5-by-tflab.zip
https://www.metalsmine.com/thread/13...r-for-mt4-free
https://www.forexfactory.com/thread/...-in-metatrader
Prop Firm DrawDown Protector : Prop Firm Capital Protection Expert MT5 |Forex Money Management: Forex Trade Management Expert MT5 | ICT Concepts Indicator MT5 |Smart Money Concepts Expert MT5 | Smart Money Trap Scanner | Get a free Expert Advisor license via Telegram and WhatsApp
Specifications of the Bollinger Bands RSI Indicator
The Bollinger Bands RSI Oscillator is designed to support various trading methodologies and asset types, making it suitable for traders with different experience levels.
Indicator Categories
- MT5 Oscillators
- MT5 Bands & Channels
Supported Platform
- MetaTrader 5 (MT5)
Required Trading Skill Level
- Elementary
Indicator Type
- MT5 Reversal Indicators
Timeframe Compatibility
- Multi-Timeframe
Trading Styles Supported
- Swing Trading
- Scalping
- Day Trading
Supported Markets
- Forex
- Cryptocurrencies
- Stocks
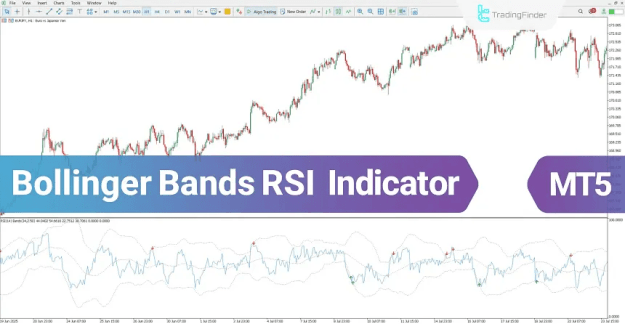
Overview of the Bollinger Bands RSI Oscillator
This oscillator evaluates the position of the RSI line relative to the upper and lower Bollinger Bands, delivering clear visual indications of market conditions.
- When the RSI line reaches the lower Bollinger Band, the market is considered oversold, and a green arrow appears to signal a potential buy opportunity.
- When the RSI line touches the upper Bollinger Band, the market enters an overbought state, and a red arrow highlights a potential sell setup.
These visual cues enable traders to quickly identify high-probability trading opportunities.
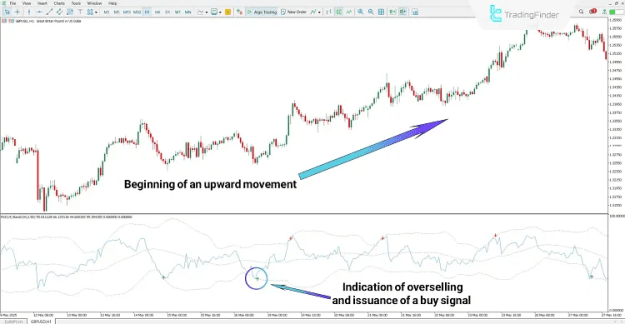
Buy Signal Conditions
On the GBP/USD price chart in the 1-hour timeframe, a buy signal is triggered when the RSI line contacts the lower Bollinger Band, indicating oversold market conditions.
At this point:
- The indicator detects a potential bullish reversal.
- A green arrow is plotted on the chart.
- Traders may consider opening long positions aligned with the emerging upward momentum.
Identifying Reversal Zones with the Bollinger Bands RSI Indicator
By integrating RSI momentum behavior with Bollinger Bands volatility thresholds, the indicator highlights areas where price movement may be weakening.
This analytical approach improves:
- Identification of reversal zones
- Accuracy of trade timing
- Optimization of risk-to-reward ratios
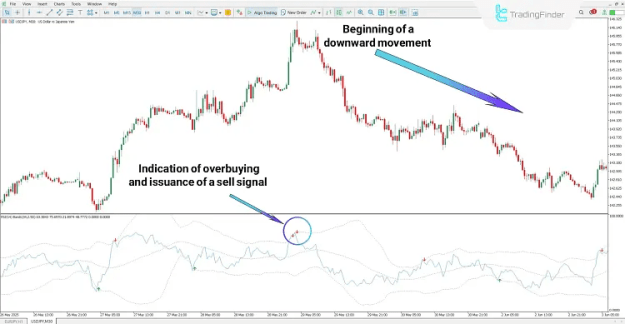
Sell Signal Conditions
On the USD/JPY chart in the 30-minute timeframe, a sell signal is generated when the RSI line touches the upper Bollinger Band, signaling overbought market conditions.
In this scenario:
- The indicator anticipates a possible bearish reversal.
- A red arrow appears on the chart.
- Traders may use this signal to initiate short positions.
Downtrend Analysis Using the Bollinger Bands RSI Oscillator
In bearish market conditions, repeated interactions between the RSI line and the upper Bollinger Band often indicate either trend continuation or corrective pullbacks.
Therefore, this oscillator is particularly effective for:
- Short-term trend analysis
- Counter-trend trading strategies
- High-precision sell entries
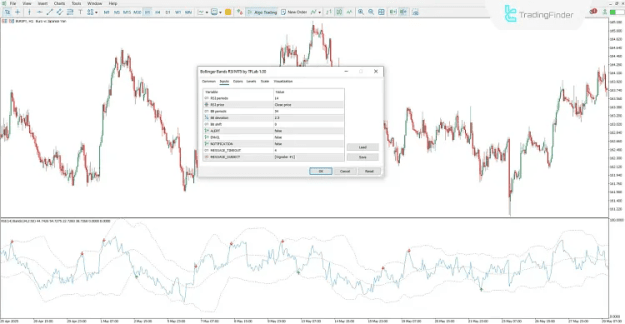
Settings of the Bollinger Bands RSI Indicator
The Bollinger Bands RSI Oscillator provides a range of customizable settings, allowing traders to adapt the indicator to different market environments and trading preferences:
- RSI Period: Defines the calculation period of the Relative Strength Index
- RSI Price: Specifies the price source used for RSI calculations
- BB Periods: Determines the number of periods applied to Bollinger Bands
- BB Deviation: Sets the standard deviation value for band width
- BB Shift: Adjusts the horizontal offset of the Bollinger Bands
- ALERT: Activates visual or sound alerts
- EMAIL: Sends trading alerts via email
- NOTIFICATION: Enables push notifications
- MESSAGE_TIMEOUT: Controls the display duration of alert messages
- MESSAGE_SUBJECT: Defines the alert message title
Conclusion
The Bollinger Bands RSI Oscillator effectively merges volatility analysis with momentum measurement to identify overbought and oversold market conditions with clarity.
- Interaction with the lower Bollinger Band generates buy signals.
- Interaction with the upper Bollinger Band produces sell signals.
This indicator is a dependable analytical solution for traders in forex, cryptocurrency, and stock markets, offering clear visual guidance and flexible settings compatible with multiple trading styles