https://cdn.tradingfinder.com/file/5...5-by-tflab.zip
https://www.metalsmine.com/thread/13...trader-4-tflab
https://www.forexfactory.com/thread/...-in-metatrader
Prop Firm DrawDown Protector : Prop Firm Capital Protection Expert MT5 |Forex Money Management: Forex Trade Management Expert MT5 | ICT Concepts Indicator MT5 |Smart Money Concepts Expert MT5 | Smart Money Trap Scanner | Get a free Expert Advisor license via Telegram and WhatsApp
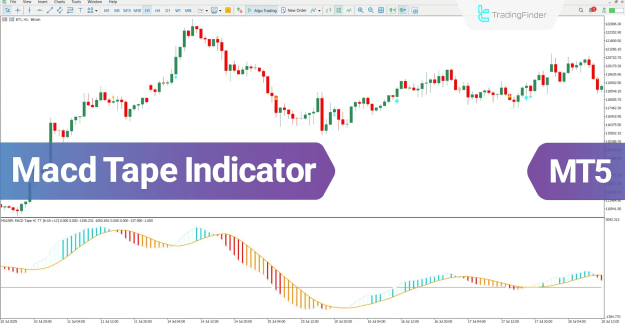
Specifications of the MACD Tape Oscillator
- Indicator Categories: Oscillators, Signal & Forecast, Momentum
- Platforms: MetaTrader 5
- Skill Level: Beginner to Intermediate
- Indicator Types: Reversal Indicators
- Timeframes: Multi-Timeframe
- Trading Styles: Swing Trading, Scalping, Day Trading
- Applicable Instruments: Forex, Crypto, Stocks, Commodities, Indices, Shares
Core Functionality
The MACD Tape oscillator detects crossovers between the MACD line and the signal line, highlighting potential entry and exit points with colored arrows:
- Blue Arrow: Buy signal
- Yellow Arrow: Sell alert
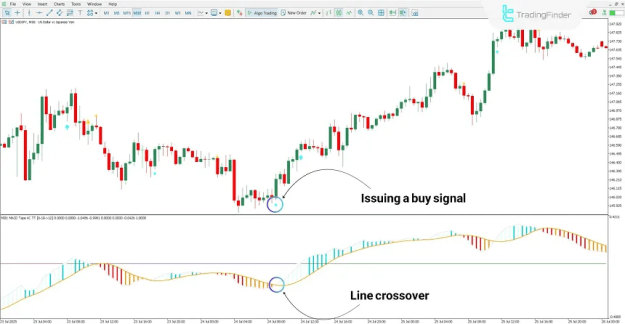
Buy Signal Example
On a 30-minute USD/JPY chart, the MACD Tape identified a bullish crossover, issuing a buy signal. Consecutive light blue histograms indicated increased positive momentum and confirmed the uptrend.
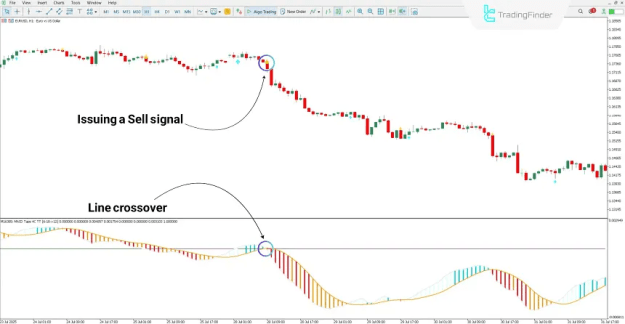
Sell Signal Example
On a 1-hour EUR/USD chart, a bearish crossover generated a sell signal. Following this signal, red and orange histograms reflected rising selling pressure and a strengthening downtrend.
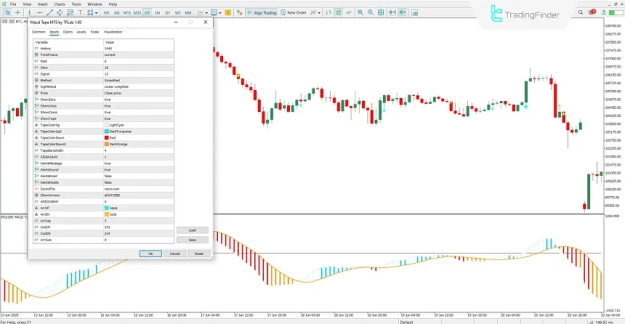
Adjustable Settings
The MACD Tape indicator provides extensive configuration options for precision trading:
- History: Number of analyzed candles
- TimeFrame: Chart timeframe
- Fast/Slow: Moving average periods
- Signal/Method: Signal line calculation and averaging type
- SigMethod: Averaging for signal line
- Price Type: Price for calculation
- ShowZero: Zero line visibility
- ShowLines: Histogram reference lines
- ShowCross: Enable MACD line crossover detection
- ShowTape: Histogram color bands
- TapeColorUp/Down: Initial and strong bullish/bearish colors
- TapeBarsWidth: Histogram bar width
- Signal Arrows: Color, symbol, size, and position
- Alerts: Text, sound, email, mobile notifications
Conclusion
The MACD Tape oscillator is a practical technical analysis tool, allowing traders to visualize market momentum and identify trend reversals. By combining histogram color shifts with crossover signals, it highlights high-probability entry and exit points. Its real-time alert system ensures traders stay informed of critical market movements across multiple instruments.